J Res Clin Med. 12:20.
doi: 10.34172/jrcm.34638
Systematic Review
The activity of different brain regions in fatigued and drowsy drivers: A systematic review based on EEG findings
Morteza Ghojazadeh Conceptualization, Data curation, Project administration, Writing – review & editing, 1 
Mostafa Farahbakhsh Conceptualization, Data curation, Supervision, Writing – review & editing, 2
Hadi Sahrai Methodology, Writing – original draft, Writing – review & editing, 3
Rasa Beheshti Data curation, Methodology, Writing – review & editing, 3
Ali Norouzi Data curation, Methodology, Supervision, Writing – review & editing, 4, *
Homayoun Sadeghi-Bazargani Conceptualization, Supervision, Writing – review & editing, 4, *
Author information:
1Neurosciences Research Center (NSRC), Tabriz University of Medical Sciences, Tabriz, Iran
2Research Center of Psychiatry and Behavioral Sciences, Tabriz University of Medical Sciences, Tabriz, Iran
3Student Research Committee, Tabriz University of Medical Sciences, Tabriz, Iran
4Road and Traffic Injury Research Center, Department of Statistics and Epidemiology, Faculty of Health, Tabriz University of Medical Sciences, Tabriz, Iran
Abstract
Introduction:
Drowsiness and fatigue during driving is one of the major causes of traffic accidents, morbidity, and mortality in societies. Known electroencephalography (EEG) as a gold standard in fatigue detection, this study aims to determine the alterations in different brain regions in fatigued and drowsy drivers.
Methods:
The databases PubMed, Scopus, Web of Science, and Embase have been systematically searched for published studies until September 1, 2023. Also, the references of the relevant articles have been searched manually. Reporting the quality assessment of the studies has been done by the Joanna Briggs Institute (JBI) critical appraisal tool for experimental studies. The study purpose was achieved using appropriate statistical methods.
Results:
Sixty-five eligible studies consisting of 1450 participants were included. The most common age and gender between participants is young males. The majority of the studies were held in high-income countries. Simulated car driving studies are utilized frequently in the studies. Common brain-wave changes seen in various regions include increased alpha in the occipital area (51.7%) and decreased alpha in the frontal region (eight out of eight simulated driving studies), decreased beta in the frontal region (25.8% of driving simulated studies), increased theta in the frontal region (36.2%), and decreased gamma in the central and temporal areas. Delta waves increase throughout the brain in an equal proportion.
Conclusion:
The occipital alpha increase, frontal beta decrease, frontal theta increase, and central and temporal gamma decrease, are frequent findings among the studies reporting fatigue and drowsiness. Based on the discrepancies and inconsistencies reported in EEG results, the detection of fatigue and drowsiness in the driving task via EEG data should be done with caution.
Keywords: Driving, Drowsiness, Electroencephalography, Fatigue, Sleepiness, Somnolence
Copyright and License Information
© 2024 The Authors.
This is an open access article distributed under the terms of the Creative Commons Attribution License (
http://creativecommons.org/licenses/by/4.0/), which permits unrestricted use, distribution, and reproduction in any medium, provided the original work is properly cited.
Funding Statement
No fund.
Introduction
Driving a vehicle is a complicated process that necessitates the coordination of various constituents such as cognitive, perceptual, sensory, and motor functions. Disturbance in any of these actions can result in irreparable injuries.1 Traffic accidents are the most common cause of death in adolescents and the sixth leading cause of disability in life years as stated by the disability-adjusted life year (DALY) standard of disability.2,3 Factors such as speeding, alcohol and drug consumption, fatigue, and drowsiness while driving are the leading causes of traffic accidents.4-6
Drowsiness in driving refers to “the urge to fall asleep” while driving, which is due to a biological necessity that is permanently created in the physiological state in the absence of sleep for a long time and in long-term awakenings.7 Fatigue, on the other hand, is demarcated as the “disinclination to continue performing the task at hand” that results from repetitive and monotonous physical work, such as driving long distances.8 Given that the consequences of these two modes usually overlap and can have similar effects, they have often been considered together in different studies.9
Fatigue and drowsiness while driving are the cause of 15%-33% of mortality and serious accidents in the United States.10 Another study states that this number is about 20% on average in developed countries.11 The prevalence of accidents due to fatigue and drowsiness is higher in young adults (especially between the ages of 18 and 24) than in older adults.12 This condition can be due to the lower tolerance of young adults to sleep deprivation,13 insufficient maturity of decision-making areas,14 and longer reaction time to older drivers,15 which makes them more vulnerable during sleep deprivation. Various factors such as excessive insomnia, working long shifts that alter the circadian rhythm, fatigue, sedatives, and alcohol consumption during fatigue can induce a feeling of drowsiness while driving.16 Previously it is concluded that the driver’s fatigue and drowsiness can be assessed using physiological signals, e.g., electroencephalography (EEG), electrocardiography (ECG), electrooculography (EOG), and electromyography (EMG).17
EEG is a technique that records the electrical activity of the brain in the form of waves and signals in the form of an encephalogram. This is done by placing electrodes on the scalp. This method can be used to assess brain activity during various activities and diagnose various brain disorders.18 Brain EEG waves are classified into five bands based on their frequency: delta (0-4 Hz), theta (4-7.5 Hz), alpha (7.5-13 Hz), beta (13-30 Hz), and gamma ( > 30 Hz).19 As a summary of EEG waves, alpha bands tend to occur when the eyes are closed and resting. Beta bands, as high frequency bands, are usually related to concentration and psychological tension. Also, it can increase during the feeling of drowsiness. Theta band is a low-frequency band that tends to occur transiently during sleep, while the delta band commonly occurs in deep sleep. The gamma band is a high-frequency band that occurs during consciousness, perception, and motor control.20,21
Numerous studies have shown changes in EEG waves in drivers due to the state of fatigue and drowsiness. However, there is no systematic review to more accurately determine the quality of function of different brain regions in fatigued and drowsy drivers. This study aimed to assess the activity of various brain regions in EEG waves in drivers with fatigue and drowsiness as a systematic review study. This can evaluate the precision of the change in the activity of different areas of the brain in these drivers. Given that the prevalence of traffic accidents and the number of casualties and serious injuries resulting from them is very high, more accurately recognizing and assessing the activity of different brain areas in sleepy drivers can be a huge stride toward reducing casualties and injuries from road accidents in drivers with fatigue and drowsiness.
Methods
This manuscript was written following the PRISMA checklist based on the Preferred Reporting Items for Systematic Reviews and Meta-Analyses 2020 (PRISMA) statement.22 The study protocol has been registered in PROSPERO. (PROSPERO ID: CRD42022303074)
Search strategy
In this study, the databases PubMed, Scopus, Web of Science, and Embase have been systematically searched for published studies until September 1st, 2023, based on the following keywords and strategy designed by authors: “accident”, “driving,” “drowsiness,” “electroencephalography,” “fatigue,” and “somnolence” (Supplementary file 1). In addition, the reference lists of relevant articles were inspected to identify potential studies meeting the selection criteria.
Inclusion and exclusion criteria
Studies evaluating drowsiness and fatigue during driving, and reporting the changes in EEG in different brain regions (the measured magnitude, magnitude change, and band powers), which are matched with PICO (participants: fatigued and drowsy, but healthy drivers (the age more than 18 years old), intervention: induced fatigue or drowsiness, comparison: alert driving, outcome: reported band power alterations) are discussed in this study. Also, related peer-reviewed English articles are included.
The studies with any of the following criteria have been excluded from this review: 1) case reports, review articles, letters, comments, non-English articles, and book chapters, 2) studies that do not report the EEG band power changes in brain regions, and only describes the detection method, 3) survey articles (cross-sectional, cohort, and case-control studies).
Reporting quality assessment
The quality of the included studies was reported using the Joanna Briggs Institute (JBI) critical appraisal tools for experimental studies, by two authors independently (A.N and R.B). All disagreements were resolved by reaching an agreement among the parties involved. Due to the nature of the studies included, one of the questions regarding the time of follow-up is not applicable to this study (question no. 6 in Supplementary file 2)
Study selection
Based on the keywords and the eligibility criteria, the following steps were taken by two authors independently: 1) identifying the titles related to the study concept, 2) removal of duplicates, 3) screening the titles and abstracts of the studies as a result of the primary search, 4) evaluating the full text of the included studies in the earlier step, 5) the final inclusion for data collection.
Duplicate studies were removed, and the studies that met the inclusion criteria of this systematic review were included by assessing the title, abstract, and full text using bibliographic reference management software, EndNote® version 20 by Thomson Reuters, Philadelphia, USA.
Data extraction and outcome definitions
Two authors, namely A.N and H.S, screened studies based on specific inclusion and exclusion criteria. They then extracted the data on demographics, interventions, and outcomes separately. In case of any disputes, they were resolved through consensus.
Data analysis
We had initially planned to conduct a meta-analysis to determine the combined impact of fatigue and drowsiness on EEG brain alterations in various brain regions. However, we encountered a challenge as the studies used different metrics and parameters to measure EEG alterations, such as power spectral density, magnitude changes in band powers, and absolute or relative band powers. The majority of studies reported qualitative changes in EEG band powers as either decreased or increased in specific brain regions. Due to this inconsistency, we decided against performing the meta-analysis as it would have been unreliable.
Results
Study selection
The total result of the systematic search was 6222 studies which 2798 were duplicates. After evaluating the study full-text based on the eligibility criteria and quality assessment of the studies, 443 studies were excluded from our study. Finally, 65 studies were included in our systematic review study (Figure 1).
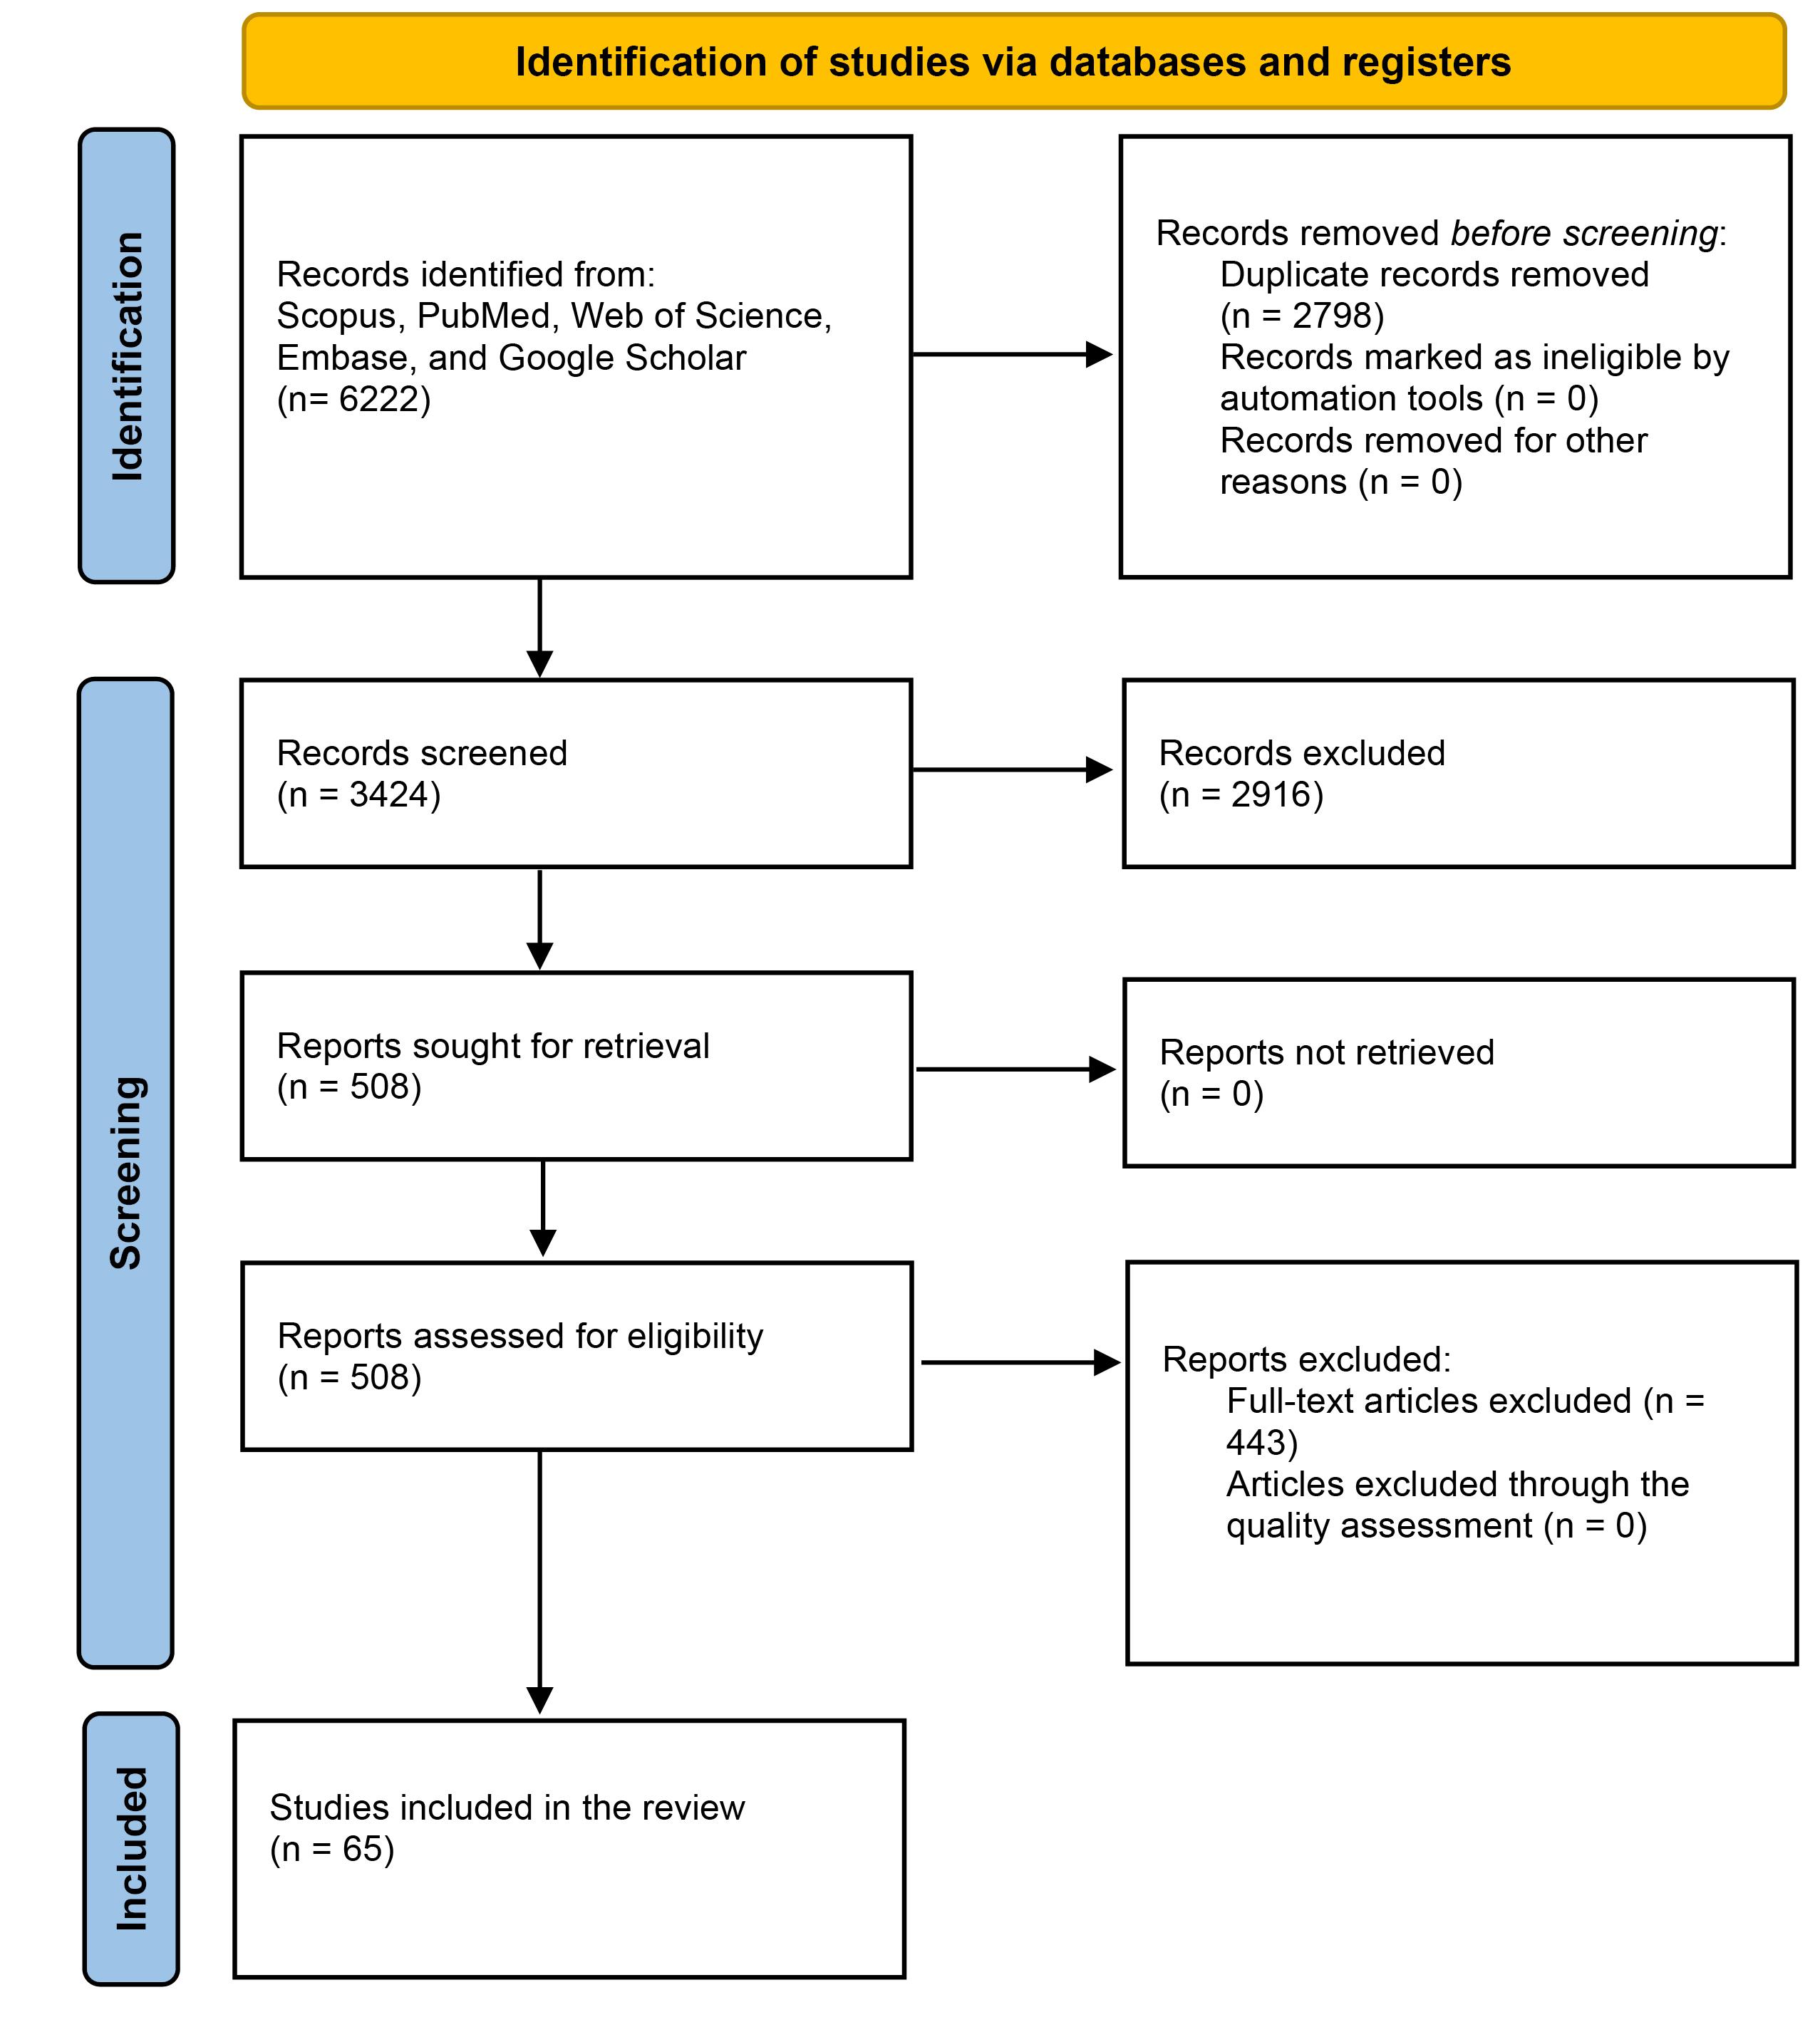
Figure 1.
The PRISMA flowchart
.
The PRISMA flowchart
Study characteristics
Demographic characteristics
All of the included articles were published between 1987 and 2023 (median: 2016, IQ3:2019 ). As the classification reported by the World Bank classification, approximately 61.5% of the studies were accomplished in high-income countries (HICs). In contrast, 24.5% and 14% of the studies are conducted in upper-middle (UMICs) and lower-middle-income (LMICs) countries, respectively. A total of 1450 participants were included and evaluated (with the largest sample size of 72 and the smallest sample size of six participants). From the studies reporting the genders of participants, 870 of them were men and 236 were women. Most of the participants’ age was in the range of 25-40 years. (Supplementary file 3).
Driving characteristics
Out of the 65 studies analyzed, 56 of them (86%) involved simulated driving tasks. Additionally, nine of the studies were conducted in an actual driving environment. The experiments are divided into real and simulated car driving, train driving, and flying. The studies varied in terms of the time of day the driving assessments were conducted, with some being done in the early afternoon, some at midnight, and others at various times throughout the day. Of the 65 studies, 21 of them (32.3%) evaluated driver fatigue and drowsiness in the early afternoon and after lunch, comparing the results with the alert state. The duration of the task typically ranged from 60 to 90 minutes in most studies. Monotonous driving was the most frequent way to induce fatigue and drowsiness in drivers (77%), while 15 studies induced fatigue and drowsiness through sleep deprivation. Subjective assessment of fatigue and drowsiness in the majority of the studies (40.6%) was assessed by Karolinska Sleepiness Score (KSS). During driving experiments, researchers frequently employ simulator-based environments. In some studies, researchers evaluate driver fatigue and drowsiness while driving in video games or virtual reality based (VR) simulators. Most studies that provide details on simulator specifications use a single screen to replicate genuine driving conditions. In the majority of studies reporting driver speed during experiments, the speed range typically falls between 60-100 km/h (Supplementary file 3).
EEG data acquisition characteristics
Forty studies (61.5%) out of 65 studies use the 10-20 international system for placing the electrodes on drivers’ heads. The number of channels used in every study ranges from 2 to 128 electrodes, although it is more frequent to utilize 32-channel and 19-channel EEG (16 of 65 studies) during data recording. In the majority of the studies (22 of 65), the electroencephalographic samples the EEG data using a sampling rate of approximately 250 Hz (Supplementary file 3).
The effect of fatigued and drowsy driving on EEG signals
As demonstrated in Table 1 the included studies have categorized the waves into five bands, known as Delta (0.5-4 Hz), Theta (4-8 Hz), Alpha (8-13 Hz), Beta (13-40 Hz), and Gamma ( > 30 Hz). The majority of the studies have evaluated the alpha-band alterations in different brain regions.
Table 1.
EEG alterations in brain regions in the included studies
|
Study
|
Year
|
Task
|
ROI
|
Changes
|
| Ahn et al23 |
2016 |
SD |
WB |
α↑ right centroparietal, β↓ frontocentral regions |
| Akbar et al24 |
2017 |
SD |
WB |
α↑ |
| Akbar et al25 |
2019 |
SD |
occipital lobe(O1) |
α↑ |
| Awais et al26 |
2017 |
SD |
Occipital, parietal, central |
Absolute α↑:C3, Cz, O1, O2, P3, P4, P7/ θ↑ in P4, δ↑ in P4 and C3. Relative α↑ in O1, O2, P4, P8. |
| Bose et al27 |
2019 |
SD |
WB |
Corresponding frequency bands of the common electrodes: AFpz θ/β/ AFp4h α/ CCP5h β/ CCP6h γ/ POz θ/β/ PO4 β/ PO7 γ/ O1h β/ Oz δ, α, β, θ/β/ O2h θ/β/ PO8 θ/β |
| Brown et al28 |
2013 |
SD |
Central, parietal, occipital, temporal |
α↑: C3, C4, P3, P4, POz/ θ↑:C3, C4/ |
| Nguyen et al29 |
2023 |
SD |
The whole brain evaluates the functional and critical connectivity. (FP1, AF3, F7, F3, FC1, FC5, T7, C3, CP1, CP5, P7, P3, PZ, PO3, O1, OZ, O2, PO4, P4, P8, CP6, CP2, C4, T8, FC6, FC2, F4, F8, AF4, FP2, FZ, and CZ) |
θ, δ, α↑ / γ, β↓ |
| Chuang et al30 |
2018 |
SD |
WB |
α, θ↑, high α power: fatigue-fighting phenomenon |
| Foong et al31 |
2019 |
SD |
TP9, TP10, Fp1, Fp2 |
frontal ↑θ, / α, β↓ |
| Gharagozlou et al32 |
2015 |
SD |
O1, O2, P3, P4, P7, P8, OZ, FP1, FP2, CZ, FZ, T7 and T8 |
α↑ in parietal region (esp. p4) |
| Guo et al33 |
2016 |
SD |
WB |
α↑ and β↓ |
| Hamann et al34 |
2023 |
Simulated flying |
WB |
Frontal θ↑ (Fz, F3, F4). Parietal α↑ (Pz, P3, P4) / parietal β↑(Pz) |
| Jagannath et al35 |
2014 |
SD |
frontal (F3, F4), parietal (P3, P4), temporal (T3, T4) and occipital (O1, O2) |
α↑ (temporal and occipital) and θ↑ (temporal occipital) and decrease in β↓ (frontal, temporal, and occipital)/ parietal β↑, and α, θ↓: NS |
| Kar et al36 |
2010 |
Real and simulated driving |
Fp1, Fp2, F3, F4, T3, T4, C3, C4, P3, P4, O1, O2, and CZ |
α, β ↑ |
| Lal et al37 |
2002 |
SD |
WB |
increase in the magnitudes in the entire head. δ and θ with 22% and 24%, respectively. α 9% and β 5%. |
| Lee et al38 |
2014 |
SD |
Fpz-Cz-Pz-OZ |
δ↓ in Pz-Oz,
θ + α/beta, and θ + α/α + β ↑in Pz-Oz |
| Nguyen et al39 |
2017 |
SD |
WB |
α↑ (parietal lobes), θ↑, and δ↑ (WB), γ↓ (temporal lobe) and β↓ (frontal lobe) |
| Otmani et al40 |
2005 |
SD |
F3, C3, P3, O1(frontal, parietal, occipital, central) |
α↑ |
| Pal et al41 |
2008 |
SD |
Oz(occipital) |
α, θ↑ |
| Pradeep Kumar et al42 |
2021 |
SD |
FP1, FP2, F7, F3, FZ, F4, F8, T3, C3, CZ, C4, T4, M2, M1, T5, P3, PZ, P4, T6, O1 and O2 |
NM clearly (better detection of drowsiness in O1, T5, F3, C4 for α/ F3, F8, O2, T5 for θ) |
| Puspasari et al43 |
2023 |
SD |
NM exactly |
α, β, θ↑ in the sleep-deprived group compared to the alert group. When driving monotonously, α, θ↑ (esp. θ) and β↓ |
| Puspasari et al44 |
2017 |
SD |
(F3, F4, F7, F8, AF3, and AF4) |
α, β↓ in the frontal region θ, δ↑ in the frontal region. |
| Shoaib et al45 |
2023 |
SD |
PPO9 h, POO9 h, POO1, OI1 h, POO2, OI2 h, POO10 h, and PPO10 h in the visual cortex and AFF5 h, AFp1, AFF1 h, AFp2, AFF2 h, and AFF6 h in the prefrontal cortex. |
β↓ (other bands were NS) |
| Sun et al46 |
2014 |
SD |
WB |
α↓ slightly/ β: stable |
| Torsvall et al47 |
1987 |
Real train driving |
O2-P4 |
α, θ↑/ δ↓ |
| Wang et al48 |
2021 |
SD |
Fp1, Fp2, F7, F3, Fz, F4, F8, FT7, FC3,
FCz, FC4, FT8, T3, C3, CZ, C4, T4, TP7, CP3, CPz, CP4,
TP8, T5, P3, PZ, P4, T6, O1, OZ, O2 |
δ, θ↑, and α, β↓ (F7, F8, FT7, FCz,
FT8, T3, T4, TP7, CPz, TP8, O1, O2 with more betweenness centrality) |
| Wang et al49 |
2019 |
Simulated flying |
O1, O2, T7, T8, P3, Pz, P4, C3, Cz, C4, F3, Fz, F4 |
δ↓ in all regions during microsleep./θ and β: NS/ α↑ in all regions during microsleep. |
| Wei et al50 |
2018 |
SD |
Fp1, Fp2, F7, F8, A1, and A2 were placed in NHB areas, the rest of them in HB areas. (HB: hair-bearing). |
θ↓ in central, θ↑ in frontal. α↑ in frontal, central, parietal, and occipital. β↑ in parietal, frontal, central, and occipital. |
| Wijesuriya et al51 |
2007 |
SD |
F3, Fz, F4, C3, Cz, C4, P3, Pz, P4, O1, Oz, and O2 |
δ↑ in O2. (not α) |
| Zhang et al52 |
2013 |
SD |
AF3, F7, F3, FC5, T7, P7, O1, O2, P8, T8, FC6, F4, F8, AF4 |
increase in entropy of α/β and (α + θ)/β in fatigued drivers compared to after rest. (after driving avg. of α/β: 0.3854/ after rest avg. of α/β:0.3414) (after driving avg. of (α + θ)/β:0.5229/ after rest avg. of (α + θ)/β:0.4325) |
| Zhang et al53 |
2020 |
SD |
Fp1, Fp2, F7, F3, Fz, F4, F8, T3, C3, Cz, C4, T4, T5, P3, Pz, P4, T6, O1, and O2 |
α↑ in posterior brain regions. (not significant) especially in the left hemisphere. |
| Zhang et al54 |
2021 |
SD |
P3, P4, Pz |
α↑ |
| Zheng et al 55 |
2017 |
SD |
12-channel EEG signals from the posterior site (CP1, CPZ, CP2, P1, PZ, P2, PO3, POZ, PO4, O1, OZ, and O2) and 6-channel EEG signals from the temporal site (FT7, FT8, T7, T8, TP7, and TP8) |
θ, α↑and γ↓ in temporal and parietal areas |
| Zuraida et al56 |
2022 |
SD |
WB |
θ↓ in temporal and occipital, θ↑ in parietal. β↑ in temporal, slightly β↓ in frontal. (θ + α)/(α + β) and (θ / α + β): ↓ in temporal. |
| Åkerstedt et al57 |
2010 |
SD |
Fz-A1, Cz-A2 and Oz–Pz |
α↑ |
| Ahlström et al58 |
2017 |
SD |
CZ-A2 |
α, θ↑ |
| Akbar et al59 |
2015 |
SD |
occipital lobe (O1 and O2) |
α↑ in occipital lobe" |
| Zuraida et al60 |
2019 |
SD |
frontal and occipital |
Morning session: α↑ in frontal and occipital, β↑ in occipital, θ↑ in frontal and occipital. (NS in all three bands)/ Night session: α↑in occipital, β↑ in frontal and occipital, θ↑ significantly in frontal and occipital. |
| Awais et al61 |
2014 |
SD |
WB |
α, θ↑ in occipital and parietal regions |
| Caldwell et al62 |
2009 |
Real flying aircraft |
Cz, Fz, Pz, |
laboratory data (between sessions) Fz, Cz, and Pz. δ↑. θ↑ (Fz, Pz, Cz). α↓ in Cz and Pz. β: NS. In-flight: α, θ, δ↑. Beta was NS. |
| Campagne et al12 |
2003 |
SD |
F3 (frontal), C3 (central), P3(parietal), and O1 (occipital), referenced to A2 |
α, θ↑ |
| Chen et al63 |
2018 |
SD |
frontal, temporal, central parietal, occipital |
δ↑ in central. θ↑ in the frontal and temporal, and θ↓ in the occipital. α↑ in central and occipital. β↓ in the parietal and occipital. |
| Zhang et al64 |
2018 |
SD |
frontal and temporal, two frontals (Fp1, Fp2) and two temporals (T3, T4) of the brain |
δ↑, θ↓, α↓ |
| Craig et al65 |
2011 |
SD |
WB |
α, θ↑/ δ: NS Fast-wave activities were increased in the frontal area of the brain. β↑ |
| Eoh et al66 |
2004 |
SD |
(Fp1, Fp2, T3, T4, P3, P4, O1, O2) |
α, θ↑ |
| Filtness et al67 |
2012 |
SD |
C3, C4 |
α, θ↑ |
| Dunbar et al68 |
2020 |
SD |
NM |
α, θ↑ |
| Jap et al69 |
2009 |
SD |
WB |
significant indices change in temporal site, not significant for other regions. NS α↓ and significant β↓ activity. θ activity in the parietal, central, and frontal. δ activity in frontal. |
| Kecklund et al70 |
1993 |
Real driving |
CZ-OZ |
α, θ↑ |
| Lees et al71 |
2018 |
Train simulated driving |
Fp1, Fp2, F7, F3, Fz, F4, F8, FT7, FC3, FCz, FC4, FT8, T7, C3, Cz, C4, T8, TP7, CP3, CPz, CP4, TP8, P7, P3, Pz, P4, P8, O1, Oz, and O2 |
δ↓(CP3, Oz) and θ↓(F7,F8,P7,FT7,P3,p8,CP3,CPz) in drowsiness, α↓(Oz,FP1,CP3,FP1),β↓ (in FT7,FT8,P3,P4) and β↑(in TP8), γ↑(FCz,C4,F4) |
| Lowden et al72 |
2009 |
SD |
Fz-A1, Cz-A2 and Oz-Pz. |
α↑, θ↑ |
| Otmani et al73 |
2005 |
SD |
F3, C3, P3, O1 |
α, θ↑ during driving with sleep deprivation, not sleep deprivation alone) |
| Li et al74 |
2013 |
Road driving |
WB |
γ, β↓ + α↑, θ↑. The ratio of (α + θ)/β ↑ |
| Ma et al75 |
2018 |
SD |
C1, C2, CP1, CP2, P1, and P2 |
α, θ↑ / β↓ |
| Jap et al76 |
2010 |
SD |
(FP1–FP2, C3–C4, T7–T8, P7–P8, and O1–O2 |
stable δ, θ activities over time, NS α↓, β↓ (p < 0.05) |
| Phipps-Nelson et al77 |
2010 |
SD |
F3, F4, C3, C4, P3, P4, O1 and O2 |
θ, δ, α↑ |
| Perrier et al78 |
2016 |
Real driving condition |
(frontal cluster (Fp1, Fp2, F3, F4, Fz, F8, F7); Central cluster (FC3, FC4, C3, C4, Cz, CP3, CP4) and Parieto-occipital cluster (P3, P4, Pz, P7, P8, O1, O2). |
θ↑ until S4 (section 4) and then decreased until S6. These differences seemed enhanced after sleep deprivation. After sleep deprivation α↑ until S4, and then decreases until S6. β: NS |
| Papadelis et al79 |
2007 |
Real driving |
WB |
δ↑: C3, P3, O1, P4, and O2. α↑ in p3. other sites were not significant. / β↓ in all bands except in the frontal. γ↓ in C3, P3, C4, and P4. θ: NS |
| Kee et al80 |
2010 |
SD |
F3, F4, C3, C4, O1 and O2 |
α, β, θ ↑ |
| Simon et al81 |
2011 |
Real driving |
frontal (F: 3, 1, z, 2, 4; FC: 3, 1, z, 4), central (C: 3, 1, 2, 4; CP: 3, 1, z, 2, 4) and parieto-occipital (P: 3, 1, z, 2, 4; PO: 3, z, 4; O: 1, z, 2) |
α spindle frequency is higher in the parieto-occipital region than in the central and frontal regions. |
| Sivakumar et al82 |
2021 |
SD |
FP1, FP2, F7, F3, FZ, F4, F8, T3, C3, CZ, C4, T4, M2, M1, T5, P3, PZ, P4, T6, O1 and O2 |
FP2, F4, C3, CZ, T4, and PZ in α sub-bands and F3, C3, C4, M2, M1, P4, T6, and O1 channels in θ sub-bands have better accuracy than other channels while comparing with different classifiers. |
| Zhao et al83 |
2012 |
SD + oddball task |
WB |
θ↓ in frontal, central, and occipital. α↑in parietal occipital, central, and temporal. β↓in frontal, central, and temporal. δ: NS |
| Han et al84 |
2019 |
SD |
Pre-frontal Fp1, Fpz, Fp2, AF3, AF4
Frontal F7, F5, F3, F1, Fz, F2, F4, F6, F8
Frontal-central FC5, FC3, FC1, FCz, FC2, FC4, FC6
Central C5, C3, C1, Cz, C2, C4, C6
Central-parietal CP5, CP3, CP1, CPz, CP2, CP4, CP6
Parietal P7, P5, P3, P1, Pz, P2, P4, P6, P8
Parietal-occipital PO7, PO5, PO3, POz, PO4, PO6, PO8 Occipital O1, Oz, O2
Temporal FT7, FT8, T7, T8, TP7, TP8" |
α, θ, δ↑ β: NS |
| Gibbings et al85 |
2022 |
SD |
Fp1, Fpz, Fp2, F7, F3, Fz, F4, F8, T7, C3, Cz, C4, T8, P7, P4, P8, O1, O2, M1, M2 |
α↑ in sleep restricted. (δ: FP2, F8: θ, FP1: α, /β: NS) |
| Zheng et al 86 |
2022 |
SD |
WB |
δ↓ in frontal (FC1 and F4) and parietal (P7)/not mentioned other waves) |
WB: Whole Brain; NM: not-mentioned; SD: Simulated Driving; VR: Virtual reality; NS: not significant; ↓: decrease, ↑: increase.
The majority of the studies (48 out of 65, 73.8%) reported an increase in alpha band power in different brain regions (in simulated driving experiments, the most common in the occipital region (51.7%), following the parietal (46.5%) and central regions (46.5%)), and eight of 65 (12.3%) studies reported an alpha decrease in the different regions (most commonly in the frontal region (eight out of eight)) while driving during fatigue and drowsiness. During real car driving experiments and a train driving study, it was observed that there was an increase in the alpha band, often in the parietal (eight out of nine) and occipital (seven out of nine) regions. On the other hand, in the only real flying aircraft study, there was a decrease in the alpha-band in the central and parietal regions.
Out of the 65 studies, 20 studies (30.7%) reporting beta band power showed a decrease in beta in various brain regions during driving with fatigue and drowsiness. On the other hand, 11 out of 65 studies (16.9%) reported an increase in the beta band, while six out of 65 studies (9.2%) had non-significant results for beta. The most common brain region for beta decrease during simulated driver’s fatigue is the frontal region (15 out of 58 studies, 25.8%). Also, the number of studies reporting an increase in the beta wave for each region is approximately equal.
Among the studies, 36 of them (55.3%) report an increase in theta-band activity in different brain regions, while six report a decrease in theta-band activity, and four of the studies report the theta-band changes as non-significant. During simulated driving experiments, the frontal (21 out of 58, 36.2%) showed the most common increase in theta activity. However, in driving conditions (based on six studies reporting theta decrease), theta activity decreased mostly in central and occipital regions, with slight differences in other regions.
Out of the 65 studies analyzed, 13 studies (20%) have found an increase in delta activity in various brain regions during driver’s fatigue and drowsiness. On the other hand, four studies have reported a decrease in delta activity. In the car-simulated driving studies, delta-increased activity was detected in almost the same proportion across different brain regions. In the real driving environment, one car driving study reported an increase in delta activity in central, occipital, and parietal regions, while in one real train study, a decrease in delta activity in occipital and central regions is noted.
Five out of the studies reported a decrease in gamma activity in different brain regions (more frequently in temporal and central regions). Also, one train-simulated study declared an increase in gamma activity in central and parietal regions (Supplementary file 4).
The results of the quality reporting assessment
According to the JBI critical appraisal tool (Supplementary file 2), the most concerning issue about the quality of the studies is not giving the detailed study participants’ methodology (i.e., the participants’ characteristics, and the acquisition approach that they used to remove artifacts). Besides, in the majority of the studies, there is not a control defining group.
Discussion
In this study we stated that the majority of the participants are young males. HICs and UMICs are the main countries conducting the drowsy and fatigued driver experiments based on EEG signals. In the most of the studies the task duration is ranged between 60-90 minutes, with simulated driving experiments mainly in the afternoon. Alpha band power, as one of the major indicators of driver drowsiness and fatigue, is mainly increased in the occipital region, while the decrease in alpha is mostly reported in the frontal region. For the beta wave, the decrease in the frontal is more frequently reported. The increase in theta band power in the frontal and in the delta band in all brain regions with an equal proportion is mostly reported among the studies. Gamma band decrease is dominantly seen in the central and temporal regions.
Based on previous studies, male drivers are more likely to be in life-threatening accidents,87 which justifies the difference between the number of male and female participants in this systematic review. Most of the studies included were conducted in HICs and UMICs. This may be attributed to the availability of driver simulator laboratories in HICs and UMICs, as most of the studies included are simulated driving studies. On the other hand, according to the latest report of the World Health Organization, approximately 93% of mortalities caused by road accidents occurred in LICs and LMICs.88 Therefore, there should be adequate support in LMICs and LICs to provide simulated and real driving environments.
As stated in previous studies,89 in the first 90’ of driving, the fatigue accumulation in young participants is lower than in older drivers, also this study suggests that the optimal driving task duration is 60´-75´ minutes and 105´-120´ minutes for the old and younger groups, respectively. Unlikely, in most of the included studies, the driving task duration is between 60´-90´. Thus, there should be more driving tasks with prolonged task time which can induce fatigue during experiments in drivers. Additionally, most of the experiments were conducted in the early afternoon after launch. Previously several studies concluded that the circadian rhythm has a crucial role in inducing fatigue in the afternoon,90-92 especially the time between 2 pm-4 pm. Also, the time between 2 am and 5 am has the same effect by decreasing the circadian rhythms. KSS and Stanford Sleepiness Scale (SSS) are the two most frequent questionnaires used in the detection of subjective fatigue and drowsiness in the included studies. Although the two mentioned questionnaires are beneficial in the detection of sleepiness, there should be objective driver fatigue tools combined with subjective measurements to evaluate the driver fatigue every time during the driving experiment as in the beginning and at the end of the driving session.
The majority of the studies included in the review utilized mid-level and high-level simulator-based driving environments. While simulation-based assessments of driver performance can yield similar results to real-world driving environments,93 the differences between the two cannot be ignored. Therefore, more actual driving experiments should be conducted to evaluate the findings in brain regions with more precision.
There are discrepancies in EEG data of fatigued and drowsy drivers. Studies have shown that most of the driving experiments result in increased alpha band power in different brain regions, with the occipital region being the most common, followed by the parietal and central regions. the increase in the alpha wave in this region may be attributed to repeated eye closing and also a decrease in vigilance during the driving task with fatigue.26 However, in some cases, the alpha band power decreases, most commonly in the frontal region. As reported in numerous studies, the alpha band decrease may be caused by the motivation of the driver to sleep because of fatigue, or it occurs gradually during sleep onset.94,95 Real car and train driving experiments show that there is an increase in the alpha band power, primarily in the occipital and parietal regions. On the other hand, during real-flying aircraft studies, a decrease in the alpha-band is observed in the central and parietal regions.
The frontal region was the most common brain region where beta decreased during simulated car driver’s fatigue. The reason for this can be the decrease in concentration, and worsening of the driver’s performance in the attentional processes like driving.96 Interestingly, the number of studies reporting an increase in the beta wave for each region was approximately the same. The increase in beta wave in fatigue and drowsiness driving could be because of the slowed motor activity in the drivers,65 or because of increased mental activity known as arousal theory.97
Due to the theta band’s tendency to occur during the early stages of sleep, most studies have reported an increase in this EEG band specifically in the frontal and occipital regions, which can induce sleepiness in fatigued and drowsy individuals. For the delta band, fewer studies have concluded an increase in various brain regions with the same proportion. However, the decrease in the theta and delta bands can be attributed to the driver’s trying to reimburse for fatigue.71,98
For the gamma band, the majority of the studies agreed with the decrease in gamma in the temporal and central regions. One simulated train study stated a gamma decrease during driver fatigue.71 Previous studies conclude that in muscle fatigue, the gamma band could be increased ipsilateral and contralaterally, especially in the central region, which is consistent with the mentioned study.99
Although this study tries to be a valuable resource for researchers and decision-makers, it is important to note that some limitations to this study should be taken into account. One limitation is not being able to meta-analysis statistical variables due to their variant way of reporting the outcomes. The other limitation of this study is the lack of control groups with larger sample sizes in the experiment. This study suggests that future research should consider detailed demographic eligibility criteria in experiments, in simulated and real driving environments with larger sample sizes in LMICs and LICs, and with a longer time duration. Also, the fatigue or alertness of the drivers should be evaluated by combining the subjective and objective sleepiness assessment tools.
Conclusion
In conclusion, the study highlights the importance of conducting more driving experiments to evaluate regional changes accurately. The occipital alpha increase, frontal beta decrease, frontal theta increase, and central and temporal gamma decrease, are frequent findings among the studies reporting fatigue and drowsiness. Differences in wave alterations could be due to individual variations or physiological causes, which can be better understood through studies with precise eligibility criteria and larger sample sizes. Additionally, while EEG is considered the gold standard for detecting fatigue and drowsiness, using EEG data to determine fatigue and drowsiness during driving should be cautiously approached.
Acknowledgments
We would like to acknowledge the Road Traffic Injury Research Center of Tabriz University of Medical Sciences and the National Brain Mapping Laboratory (NBML) for their assistance in extracting data for this study. It is important to note that this study is part of an MD thesis registered with number 68740 at Tabriz University of Medical Sciences in Tabriz, Iran.
Competing Interests
The authors declare no conflicts of interest regarding this article’s research, authorship, or publication.
Ethical Approval
The current study was conducted according to the principles of the Declaration of Helsinki and the study protocol was approved by the ethics committee of Tabriz University of Medical Sciences (reference number IR.TBZMED.REC.1400.1195).
Supplementary Files
Supplementary file 1. Search strategy
(pdf)
Supplementary file 2. JBI critical appraisal tool for experimental studies.
(pdf)
Supplementary file 3. The characteristics of the included studies.
(pdf)
Supplementary file 4. EEG band alterations in different brain regions. The major electroencephalographic outcomes are also mentioned.
(pdf)
References
- Anderson SW, Rizzo M, Shi Q, Uc EY, Dawson JD. Cognitive abilities related to driving performance in a simulator and crashing on the road. In: Driving Assessment Conference. University of Iowa; 2005. 10.17077/drivingassessment.1173.
- World Health Organization (WHO). Global Health Estimates: Life Expectancy and Leading Causes of Death and Disability. WHO; 2019. Available from: https://www.who.int/data/gho/data/themes/mortality-and-global-health-estimates.
- World Health Organization (WHO). Adolescent and Young Adult Health. WHO; 20213. Available from: https://www.who.int/news-room/fact-sheets/detail/adolescents-health-risksand-solutions.
- Chen F, Chen S. Injury severities of truck drivers in single- and multi-vehicle accidents on rural highways. Accid Anal Prev 2011; 43(5):1677-88. doi: 10.1016/j.aap.2011.03.026 [Crossref] [ Google Scholar]
- Chen F, Chen S, Ma X. Analysis of hourly crash likelihood using unbalanced panel data mixed logit model and real-time driving environmental big data. J Safety Res 2018; 65:153-9. doi: 10.1016/j.jsr.2018.02.010 [Crossref] [ Google Scholar]
- Tefft BC. Prevalence of Motor Vehicle Crashes Involving Drowsy Drivers, United States, 2009-2013. Washington, DC: AAA Foundation for Traffic Safety; 2014.
- Beirness DJ, Simpson HM, Desmond K. The Road Safety Monitor 2004: Drowsy Driving. National Academies of Sciences, Engineering, and Medicine; 2005.
- Brown ID. Driver fatigue. Hum Factors 1994; 36(2):298-314. doi: 10.1177/001872089403600210 [Crossref] [ Google Scholar]
- Vanlaar W, Simpson H, Mayhew D, Robertson R. Fatigued and drowsy driving: a survey of attitudes, opinions and behaviors. J Safety Res 2008; 39(3):303-9. doi: 10.1016/j.jsr.2007.12.007 [Crossref] [ Google Scholar]
- Maia Q, Grandner MA, Findley J, Gurubhagavatula I. Short and long sleep duration and risk of drowsy driving and the role of subjective sleep insufficiency. Accid Anal Prev 2013; 59:618-22. doi: 10.1016/j.aap.2013.07.028 [Crossref] [ Google Scholar]
- Shekari Soleimanloo S, White MJ, Garcia-Hansen V, Smith SS. The effects of sleep loss on young drivers’ performance: a systematic review. PLoS One 2017; 12(8):e0184002. doi: 10.1371/journal.pone.0184002 [Crossref] [ Google Scholar]
- Campagne A, Pebayle T, Muzet A. Correlation between driving errors and vigilance level: influence of the driver’s age. Physiol Behav 2004; 80(4):515-24. doi: 10.1016/j.physbeh.2003.10.004 [Crossref] [ Google Scholar]
- Duffy JF, Willson HJ, Wang W, Czeisler CA. Healthy older adults better tolerate sleep deprivation than young adults. J Am Geriatr Soc 2009; 57(7):1245-51. doi: 10.1111/j.1532-5415.2009.02303.x [Crossref] [ Google Scholar]
- Dahl RE. Biological, developmental, and neurobehavioral factors relevant to adolescent driving risks. Am J Prev Med 2008; 35(3 Suppl):S278-84. doi: 10.1016/j.amepre.2008.06.013 [Crossref] [ Google Scholar]
- Philip P, Taillard J, Sagaspe P, Valtat C, Sanchez-Ortuno M, Moore N. Age, performance and sleep deprivation. J Sleep Res 2004; 13(2):105-10. doi: 10.1111/j.1365-2869.2004.00399.x [Crossref] [ Google Scholar]
- Moradi A, Hashemi Nazari SS, Rahmani K. Sleepiness and the risk of road traffic accidents: a systematic review and meta-analysis of previous studies. Transp Res Part F Traffic Psychol Behav 2019; 65:620-9. doi: 10.1016/j.trf.2018.09.013 [Crossref] [ Google Scholar]
- Murugan S, Sivakumar PK, Kavitha C, Harichandran A, Lai WC. An electro-oculogram (EOG) sensor’s ability to detect driver hypovigilance using machine learning. Sensors (Basel) 2023; 23(6):2944. doi: 10.3390/s23062944 [Crossref] [ Google Scholar]
- Subha DP, Joseph PK, Acharya UR, Lim CM. EEG signal analysis: a survey. J Med Syst 2010; 34(2):195-212. doi: 10.1007/s10916-008-9231-z [Crossref] [ Google Scholar]
- Sheela Sobana Rani K, Pravinth Raja S, Sinthuja M, Vidhya Banu B, Sapna R, Dekeba K. Classification of EEG signals using neural network for predicting consumer choices. Comput Intell Neurosci 2022; 2022:5872401. doi: 10.1155/2022/5872401 [Crossref] [ Google Scholar]
- Nayak CS, Anilkumar AC. EEG normal waveforms. In: StatPearls [Internet]. Treasure Island, FL: StatPearls Publishing; 2024. Available from: https://www.ncbi.nlm.nih.gov/books/NBK539805/.
- Amo C, de Santiago L, Barea R, López-Dorado A, Boquete L. Analysis of gamma-band activity from human EEG using empirical mode decomposition. Sensors (Basel) 2017; 17(5):989. doi: 10.3390/s17050989 [Crossref] [ Google Scholar]
- Page MJ, McKenzie JE, Bossuyt PM, Boutron I, Hoffmann TC, Mulrow CD. The PRISMA 2020 statement: an updated guideline for reporting systematic reviews. Int J Surg 2021; 88:105906. doi: 10.1016/j.ijsu.2021.105906 [Crossref] [ Google Scholar]
- Ahn S, Nguyen T, Jang H, Kim JG, Jun SC. Exploring neuro-physiological correlates of drivers’ mental fatigue caused by sleep deprivation using simultaneous EEG, ECG, and fNIRS data. Front Hum Neurosci 2016; 10:219. doi: 10.3389/fnhum.2016.00219 [Crossref] [ Google Scholar]
- Akbar IA, Rumagit AM, Utsunomiya M, Morie T, Igasaki T. Three drowsiness categories assessment by electroencephalogram in driving simulator environment. In: 2017 39th Annual International Conference of the IEEE Engineering in Medicine and Biology Society (EMBC). Jeju, Korea: IEEE; 2017. 10.1109/embc.2017.8037464.
- Akbar IA, Igasaki T. Drowsiness estimation using electroencephalogram and recurrent support vector regression. Information 2019; 10(6):217. doi: 10.3390/info10060217 [Crossref] [ Google Scholar]
- Awais M, Badruddin N, Drieberg M. A hybrid approach to detect driver drowsiness utilizing physiological signals to improve system performance and wearability. Sensors (Basel) 2017; 17(9):1991. doi: 10.3390/s17091991 [Crossref] [ Google Scholar]
- Bose R, Wang H, Dragomir A, Thakor NV, Bezerianos A, Li J. Regression-based continuous driving fatigue estimation: toward practical implementation. IEEE Trans Cogn Dev Syst 2020; 12(2):323-31. doi: 10.1109/tcds.2019.2929858 [Crossref] [ Google Scholar]
- Brown T, Johnson R, Milavetz G. Identifying periods of drowsy driving using EEG. Ann Adv Automot Med 2013; 57:99-108. [ Google Scholar]
- Nguyen KH, Ebbatson M, Tran Y, Craig A, Nguyen H, Chai R. Source-space brain functional connectivity features in electroencephalogram-based driver fatigue classification. Sensors (Basel) 2023; 23(5):2383. doi: 10.3390/s23052383 [Crossref] [ Google Scholar]
- Chuang CH, Cao Z, King JT, Wu BS, Wang YK, Lin CT. Brain electrodynamic and hemodynamic signatures against fatigue during driving. Front Neurosci 2018; 12:181. doi: 10.3389/fnins.2018.00181 [Crossref] [ Google Scholar]
- Foong R, Ang KK, Zhang Z, Quek C. An iterative cross-subject negative-unlabeled learning algorithm for quantifying passive fatigue. J Neural Eng 2019; 16(5):056013. doi: 10.1088/1741-2552/ab255d [Crossref] [ Google Scholar]
- Gharagozlou F, Nasl Saraji G, Mazloumi A, Nahvi A, Motie Nasrabadi A, Rahimi Foroushani A. Detecting driver mental fatigue based on EEG alpha power changes during simulated driving. Iran J Public Health 2015; 44(12):1693-700. [ Google Scholar]
- Guo M, Li S, Wang L, Chai M, Chen F, Wei Y. Research on the relationship between reaction ability and mental state for online assessment of driving fatigue. Int J Environ Res Public Health 2016; 13(12):1174. doi: 10.3390/ijerph13121174 [Crossref] [ Google Scholar]
- Hamann A, Carstengerdes N. Assessing the development of mental fatigue during simulated flights with concurrent EEG-fNIRS measurement. Sci Rep 2023; 13(1):4738. doi: 10.1038/s41598-023-31264-w [Crossref] [ Google Scholar]
- Jagannath M, Balasubramanian V. Assessment of early onset of driver fatigue using multimodal fatigue measures in a static simulator. Appl Ergon 2014; 45(4):1140-7. doi: 10.1016/j.apergo.2014.02.001 [Crossref] [ Google Scholar]
- Kar S, Bhagat M, Routray A. EEG signal analysis for the assessment and quantification of driver’s fatigue. Transp Res Part F Traffic Psychol Behav 2010; 13(5):297-306. doi: 10.1016/j.trf.2010.06.006 [Crossref] [ Google Scholar]
- Lal SK, Craig A. Driver fatigue: electroencephalography and psychological assessment. Psychophysiology 2002; 39(3):313-21. doi: 10.1017/s0048577201393095 [Crossref] [ Google Scholar]
- Lee BG, Lee BL, Chung WY. Mobile healthcare for automatic driving sleep-onset detection using wavelet-based EEG and respiration signals. Sensors (Basel) 2014; 14(10):17915-36. doi: 10.3390/s141017915 [Crossref] [ Google Scholar]
- Nguyen T, Ahn S, Jang H, Jun SC, Kim JG. Utilization of a combined EEG/NIRS system to predict driver drowsiness. Sci Rep 2017; 7:43933. doi: 10.1038/srep43933 [Crossref] [ Google Scholar]
- Otmani S, Rogé J, Muzet A. Sleepiness in professional drivers: effect of age and time of day. Accid Anal Prev 2005; 37(5):930-7. doi: 10.1016/j.aap.2005.04.011 [Crossref] [ Google Scholar]
- Pal NR, Chuang CY, Ko LW, Chao CF, Jung TP, Liang SF. EEG-based subject- and session-independent drowsiness detection: an unsupervised approach. EURASIP J Adv Signal Process 2008; 2008(1):519480. doi: 10.1155/2008/519480 [Crossref] [ Google Scholar]
- Pradeep Kumar S, Murugan S, Selvaraj J, Sahayadhas A. Detecting driver mental fatigue based on Electroencephalogram (EEG) signals during simulated driving. IOP Conf Ser Mater Sci Eng 2021; 1070(1):012096. doi: 10.1088/1757-899x/1070/1/012096 [Crossref] [ Google Scholar]
- Puspasari MA, Syaifullah DH, Iqbal BM, Afranovka VA, Madani ST, Susetyo AK. Prediction of drowsiness using EEG signals in young Indonesian drivers. Heliyon 2023; 9(9):e19499. doi: 10.1016/j.heliyon.2023.e19499 [Crossref] [ Google Scholar]
- Puspasari MA, Iridiastadi H, Sutalaksana IZ, Sjafruddin A. Effect of driving duration on EEG fluctuations. Int J Technol 2017; 8(6):1089-96. doi: 10.14716/ijtech.v8i6.716 [Crossref] [ Google Scholar]
- Shoaib Z, Akbar A, Kim ES, Kamran MA, Kim JH, Jeong MY. Utilizing EEG and fNIRS for the detection of sleep-deprivation-induced fatigue and its inhibition using colored light stimulation. Sci Rep 2023; 13(1):6465. doi: 10.1038/s41598-023-33426-2 [Crossref] [ Google Scholar]
- Sun Y, Yu XB. An innovative nonintrusive driver assistance system for vital signal monitoring. IEEE J Biomed Health Inform 2014; 18(6):1932-9. doi: 10.1109/jbhi.2014.2305403 [Crossref] [ Google Scholar]
- Torsvall L, Akerstedt T. Sleepiness on the job: continuously measured EEG changes in train drivers. Electroencephalogr Clin Neurophysiol 1987; 66(6):502-11. doi: 10.1016/0013-4694(87)90096-4 [Crossref] [ Google Scholar]
- Wang F, Wu S, Ping J, Xu Z, Chu H. EEG driving fatigue detection with PDC-based brain functional network. IEEE Sens J 2021; 21(9):10811-23. doi: 10.1109/jsen.2021.3058658 [Crossref] [ Google Scholar]
- Wang C, Guragain B, Verma AK, Archer L, Majumder S, Mohamud A. Spectral analysis of EEG during microsleep events annotated via driver monitoring system to characterize drowsiness. IEEE Trans Aerosp Electron Syst 2020; 56(2):1346-56. doi: 10.1109/taes.2019.2933960 [Crossref] [ Google Scholar]
- Wei CS, Wang YT, Lin CT, Jung TP. Toward drowsiness detection using non-hair-bearing EEG-based brain-computer interfaces. IEEE Trans Neural Syst Rehabil Eng 2018; 26(2):400-6. doi: 10.1109/tnsre.2018.2790359 [Crossref] [ Google Scholar]
- Wijesuriya N, Tran Y, Craig A. The psychophysiological determinants of fatigue. Int J Psychophysiol 2007; 63(1):77-86. doi: 10.1016/j.ijpsycho.2006.08.005 [Crossref] [ Google Scholar]
- Zhang NN, Zhang Q. Characteristic extraction of fatigue driver’s EEG signals based on wavelet entropy. Adv Mater Res 2013; 779-780:1019-22. doi: 10.4028/www.scientific.net/AMR.779-780.1019 [Crossref] [ Google Scholar]
- Zhang C, Sun L, Cong F, Kujala T, Ristaniemi T, Parviainen T. Optimal imaging of multi-channel EEG features based on a novel clustering technique for driver fatigue detection. Biomed Signal Process Control 2020; 62:102103. doi: 10.1016/j.bspc.2020.102103 [Crossref] [ Google Scholar]
- Zhang Y, Ma J, Zhang C, Chang R. Electrophysiological frequency domain analysis of driver passive fatigue under automated driving conditions. Sci Rep 2021; 11(1):20348. doi: 10.1038/s41598-021-99680-4 [Crossref] [ Google Scholar]
- Zheng WL, Lu BL. A multimodal approach to estimating vigilance using EEG and forehead EOG. J Neural Eng 2017; 14(2):026017. doi: 10.1088/1741-2552/aa5a98 [Crossref] [ Google Scholar]
- Zuraida R, Wijayanto T, Iridiastadi H. Fatigue during prolonged simulated driving: an electroencephalogram study. Int J Technol 2022; 13(2):286-96. doi: 10.14716/ijtech.v13i2.4820 [Crossref] [ Google Scholar]
- Åkerstedt T, Ingre M, Kecklund G, Anund A, Sandberg D, Wahde M. Reaction of sleepiness indicators to partial sleep deprivation, time of day and time on task in a driving simulator--the DROWSI project. J Sleep Res 2010; 19(2):298-309. doi: 10.1111/j.1365-2869.2009.00796.x [Crossref] [ Google Scholar]
- Ahlström C, Anund A, Fors C, Åkerstedt T. The effect of daylight versus darkness on driver sleepiness: a driving simulator study. J Sleep Res 2018; 27(3):e12642. doi: 10.1111/jsr.12642 [Crossref] [ Google Scholar]
- Akbar IA, Igasaki T, Murayama N, Hu Z. Drowsiness assessment using electroencephalogram in driving simulator environment. In: 2015 8th International Conference on Biomedical Engineering and Informatics (BMEI). Shenyang, China: IEEE; 2015. 10.1109/bmei.2015.7401497.
- Zuraida R, Iridiastadi H, Sutalaksana IZ, Suprijanto S. An analysis of EEG changes during prolonged simulated driving for the assessment of driver fatigue. J Eng Technol Sci 2019; 51(2):290-302. doi: 10.5614/j.eng.technol.sci.2019.51.2.9 [Crossref] [ Google Scholar]
- Awais M, Badruddin N, Drieberg M. Driver drowsiness detection using EEG power spectrum analysis. In: 2014 IEEE Region 10 Symposium. Kuala Lumpur: IEEE; 2014. 10.1109/TENCONSpring.2014.6863035.
- Caldwell JA, Hall KK, Erickson BS. EEG data collected from helicopter pilots in flight are sufficiently sensitive to detect increased fatigue from sleep deprivation. Int J Aviat Psychol 2002; 12(1):19-32. doi: 10.1207/s15327108ijap1201_3 [Crossref] [ Google Scholar]
- Chen J, Wang H, Hua C. Electroencephalography based fatigue detection using a novel feature fusion and extreme learning machine. Cogn Syst Res 2018; 52:715-28. doi: 10.1016/j.cogsys.2018.08.018 [Crossref] [ Google Scholar]
- Zhang C, Wang W, Chen C, Zeng C, Anderson DE, Cheng B. Determination of optimal electroencephalography recording locations for detecting drowsy driving. IET Intell Transp Syst 2018; 12(5):345-50. doi: 10.1049/iet-its.2017.0083 [Crossref] [ Google Scholar]
- Craig A, Tran Y, Wijesuriya N, Nguyen H. Regional brain wave activity changes associated with fatigue. Psychophysiology 2012; 49(4):574-82. doi: 10.1111/j.1469-8986.2011.01329.x [Crossref] [ Google Scholar]
- Eoh HJ, Chung MK, Kim SH. Electroencephalographic study of drowsiness in simulated driving with sleep deprivation. Int J Ind Ergon 2005; 35(4):307-20. doi: 10.1016/j.ergon.2004.09.006 [Crossref] [ Google Scholar]
- Filtness AJ, Reyner LA, Horne JA. Driver sleepiness-comparisons between young and older men during a monotonous afternoon simulated drive. Biol Psychol 2012; 89(3):580-3. doi: 10.1016/j.biopsycho.2012.01.002 [Crossref] [ Google Scholar]
- Dunbar J, Gilbert JE, Lewis B. Exploring differences between self-report and electrophysiological indices of drowsy driving: a usability examination of a personal brain-computer interface device. J Safety Res 2020; 74:27-34. doi: 10.1016/j.jsr.2020.04.006 [Crossref] [ Google Scholar]
- Jap BT, Lal S, Fischer P, Bekiaris E. Using EEG spectral components to assess algorithms for detecting fatigue. Expert Syst Appl 2009; 36(2):2352-9. doi: 10.1016/j.eswa.2007.12.043 [Crossref] [ Google Scholar]
- Kecklund G, Akerstedt T. Sleepiness in long distance truck driving: an ambulatory EEG study of night driving. Ergonomics 1993; 36(9):1007-17. doi: 10.1080/00140139308967973 [Crossref] [ Google Scholar]
- Lees T, Chalmers T, Burton D, Zilberg E, Penzel T, Lal S. Electroencephalography as a predictor of self-report fatigue/sleepiness during monotonous driving in train drivers. Physiol Meas 2018; 39(10):105012. doi: 10.1088/1361-6579/aae42e [Crossref] [ Google Scholar]
- Lowden A, Anund A, Kecklund G, Peters B, Akerstedt T. Wakefulness in young and elderly subjects driving at night in a car simulator. Accid Anal Prev 2009; 41(5):1001-7. doi: 10.1016/j.aap.2009.05.014 [Crossref] [ Google Scholar]
- Otmani S, Pebayle T, Roge J, Muzet A. Effect of driving duration and partial sleep deprivation on subsequent alertness and performance of car drivers. Physiol Behav 2005; 84(5):715-24. doi: 10.1016/j.physbeh.2005.02.021 [Crossref] [ Google Scholar]
- Li R, Su W, Lu Z. Physiological signal analysis for fatigue level of experienced and inexperienced drivers. Traffic Inj Prev 2017; 18(2):139-44. doi: 10.1080/15389588.2016.1227073 [Crossref] [ Google Scholar]
- Ma J, Gu J, Jia H, Yao Z, Chang R. The relationship between drivers’ cognitive fatigue and speed variability during monotonous daytime driving. Front Psychol 2018; 9:459. doi: 10.3389/fpsyg.2018.00459 [Crossref] [ Google Scholar]
- Jap BT, Lal S, Fischer P. Inter-hemispheric electroencephalography coherence analysis: assessing brain activity during monotonous driving. Int J Psychophysiol 2010; 76(3):169-73. doi: 10.1016/j.ijpsycho.2010.03.007 [Crossref] [ Google Scholar]
- Phipps-Nelson J, Redman JR, Rajaratnam SM. Temporal profile of prolonged, night-time driving performance: breaks from driving temporarily reduce time-on-task fatigue but not sleepiness. J Sleep Res 2011; 20(3):404-15. doi: 10.1111/j.1365-2869.2010.00900.x [Crossref] [ Google Scholar]
- Perrier J, Jongen S, Vuurman E, Bocca ML, Ramaekers JG, Vermeeren A. Driving performance and EEG fluctuations during on-the-road driving following sleep deprivation. Biol Psychol 2016; 121(Pt A):1-11. doi: 10.1016/j.biopsycho.2016.09.010 [Crossref] [ Google Scholar]
- Papadelis C, Chen Z, Kourtidou-Papadeli C, Bamidis PD, Chouvarda I, Bekiaris E. Monitoring sleepiness with on-board electrophysiological recordings for preventing sleep-deprived traffic accidents. Clin Neurophysiol 2007; 118(9):1906-22. doi: 10.1016/j.clinph.2007.04.031 [Crossref] [ Google Scholar]
- Kee S, Tamrin SB, Goh Y. Driving fatigue and performance among occupational drivers in simulated prolonged driving. Glob J Health Sci 2010; 2(1):167-77. [ Google Scholar]
- Simon M, Schmidt EA, Kincses WE, Fritzsche M, Bruns A, Aufmuth C. EEG alpha spindle measures as indicators of driver fatigue under real traffic conditions. Clin Neurophysiol 2011; 122(6):1168-78. doi: 10.1016/j.clinph.2010.10.044 [Crossref] [ Google Scholar]
- Sivakumar P, Selvaraj J, Ramaraj K, Sahayadhas A. Analysis of alpha and theta band to detect driver drowsiness using electroencephalogram (EEG) signals. Int Arab J Inf Technol 2021; 18(4):578-84. doi: 10.34028/18/4/10 [Crossref] [ Google Scholar]
- Zhao C, Zhao M, Liu J, Zheng C. Electroencephalogram and electrocardiograph assessment of mental fatigue in a driving simulator. Accid Anal Prev 2012; 45:83-90. doi: 10.1016/j.aap.2011.11.019 [Crossref] [ Google Scholar]
- Han C, Sun X, Yang Y, Che Y, Qin Y. Brain complex network characteristic analysis of fatigue during simulated driving based on electroencephalogram signals. Entropy (Basel) 2019; 21(4):353. doi: 10.3390/e21040353 [Crossref] [ Google Scholar]
- Gibbings A, Ray LB, Gagnon S, Collin CA, Robillard R, Fogel SM. The EEG correlates and dangerous behavioral consequences of drowsy driving after a single night of mild sleep deprivation. Physiol Behav 2022; 252:113822. doi: 10.1016/j.physbeh.2022.113822 [Crossref] [ Google Scholar]
- Zheng Y, Ma Y, Cammon J, Zhang S, Zhang J, Zhang Y. A new feature selection approach for driving fatigue EEG detection with a modified machine learning algorithm. Comput Biol Med 2022; 147:105718. doi: 10.1016/j.compbiomed.2022.105718 [Crossref] [ Google Scholar]
- Regev S, Rolison JJ, Moutari S. Crash risk by driver age, gender, and time of day using a new exposure methodology. J Safety Res 2018; 66:131-40. doi: 10.1016/j.jsr.2018.07.002 [Crossref] [ Google Scholar]
- World Health Organization (WHO). Road Traffic Injuries. WHO; 2022. Available from: https://www.who.int/news-room/fact-sheets/detail/road-traffic-injuries.
- Pei YL, Jin YQ, Chen HF. Fatigue characteristics in drivers of different ages based on analysis of EEG. China Journal of Highway and Transport 2018; 31(4):59-65. [ Google Scholar]
- Zhang H, Yan X, Wu C, Qiu TZ. Effect of circadian rhythms and driving duration on fatigue level and driving performance of professional drivers. Transp Res Rec 2014; 2402(1):19-27. doi: 10.3141/2402-03 [Crossref] [ Google Scholar]
- Chipman M, Jin YL. Drowsy drivers: the effect of light and circadian rhythm on crash occurrence. Saf Sci 2009; 47(10):1364-70. doi: 10.1016/j.ssci.2009.03.005 [Crossref] [ Google Scholar]
- Zhang H, Ni D, Ding N, Sun Y, Zhang Q, Li X. Structural analysis of driver fatigue behavior: a systematic review. Transp Res Interdiscip Perspect 2023; 21:100865. doi: 10.1016/j.trip.2023.100865 [Crossref] [ Google Scholar]
- Risto M, Martens MH. Driver headway choice: a comparison between driving simulator and real-road driving. Transp Res Part F Traffic Psychol Behav 2014; 25(Pt A):1-9. doi: 10.1016/j.trf.2014.05.001 [Crossref] [ Google Scholar]
- Tanaka H, Hayashi M, Hori T. Topographical characteristics and principal component structure of the hypnagogic EEG. Sleep 1997; 20(7):523-34. doi: 10.1093/sleep/20.7.523 [Crossref] [ Google Scholar]
- Strijkstra AM, Beersma DG, Drayer B, Halbesma N, Daan S. Subjective sleepiness correlates negatively with global alpha (8-12 Hz) and positively with central frontal theta (4-8 Hz) frequencies in the human resting awake electroencephalogram. Neurosci Lett 2003; 340(1):17-20. doi: 10.1016/s0304-3940(03)00033-8 [Crossref] [ Google Scholar]
- MacLean MH, Arnell KM, Cote KA. Resting EEG in alpha and beta bands predicts individual differences in attentional blink magnitude. Brain Cogn 2012; 78(3):218-29. doi: 10.1016/j.bandc.2011.12.010 [Crossref] [ Google Scholar]
- Andreassi JL. Psychophysiology: Human Behavior and Physiological Response. Psychology Press; 2010.
- Wascher E, Rasch B, Sänger J, Hoffmann S, Schneider D, Rinkenauer G. Frontal theta activity reflects distinct aspects of mental fatigue. Biol Psychol 2014; 96:57-65. doi: 10.1016/j.biopsycho.2013.11.010 [Crossref] [ Google Scholar]
- Hsu LI, Lim KW, Lai YH, Chen CS, Chou LW. Effects of muscle fatigue and recovery on the neuromuscular network after an intermittent handgrip fatigue task: spectral analysis of electroencephalography and electromyography signals. Sensors (Basel) 2023; 23(5):2440. doi: 10.3390/s23052440 [Crossref] [ Google Scholar]