J Res Clin Med. 13:34736.
doi: 10.34172/jrcm.025.34736
Original Article
Prediction of the occurrence of death in East Azerbaijan province road accidents using the traffic monitoring cameras data: An application of artificial intelligence
Reza Arabi Belaghi Conceptualization, Formal analysis, Investigation, Methodology, Software, Validation, Visualization, Writing – original draft, Writing – review & editing, 1 
Neda Gilani Conceptualization, Formal analysis, Funding acquisition, Investigation, Methodology, Project administration, Resources, Software, Supervision, Validation, Visualization, Writing – original draft, Writing – review & editing, 2, 3, *
Homayoun Sadeghi-Bazargani Conceptualization, Data curation, Funding acquisition, Resources, Validation, Writing – original draft, Writing – review & editing, 2, 3
Aysan Mohammad-Namdar Data curation, Methodology, Validation, Writing – original draft, Writing – review & editing, 2
Nasim Hajipoor Kashgsaray Investigation, Writing – original draft, Writing – review & editing, 4
Alireza Razzaghi Data curation, Validation, Writing – original draft, Writing – review & editing, 5
Mona Fazel Ghaziani Writing – original draft, Writing – review & editing, 6
Author information:
1Unit of Applied Statistics and Mathematicas, Department of Energy and Technology, Swedish University of Agricultural Sciences, Uppsala, Sweden
2Road Traffic Injury Research Center, Tabriz University of Medical Sciences, Tabriz, Iran
3Department of Statistics and Epidemiology, Faculty of Health, Tabriz University of Medical Sciences, Tabriz, Iran
4Emergency and Trauma Care Research Center, Tabriz University of Medical Sciences, Tabriz, Iran
5Children Growth Research Center, Research Institute for Prevention of Non-Communicable Diseases, Qazvin University of Medical Sciences, Qazvin, Iran
6Department of Radiology, Faculty of Allied Medical Sciences, Tabriz University of Medical Sciences, Tabriz, Iran
Abstract
Introduction:
Road traffic injuries (RTIs) are one of the most important public health problems and causes of mortality worldwide, and especially in Iran.
Methods:
We used data from 2017-03-19 to 2021-03-20 registered in RTIs by the East Azerbaijan forensic medicine organization database. Information on predictor variables was obtained from traffic monitoring cameras’ data. We developed eight machine learning prediction models: logistic regression (LR), elastic net regression, decision tree (DT), random forest (RF), extreme gradient boosting (EGB), support vector machines (SVM; linear and non-linear), and artificial neural networks (ANNs). We used RF to evaluate the importance of each predictor in the prediction of death.
Results:
The mean number of classes 1, 2, and 4 vehicles on the road on days when death occurred was significantly higher than on days without death and there was an opposite significant pattern for vehicle types 3 and 5. Similar to the training data, RF provided the highest prediction accuracy with an AUC of 91% (95% CI:88%-93%) in the testing data. The total number of type 2 vehicles on the roads is by far the most important and relevant predictor variable (variable importance:83.95) followed by the number of instances of unsafe distance while driving (58.50). The number of Class 4 vehicles (56.58%) and average speed of vehicles (56.31%) were the next most important variables.
Conclusion:
Using the RF machine learning algorithm, the occurrence of death in accidents can be predicted with very high accuracy using the number of class 2 vehicles on roads.
Keywords: Accidents, Mortality, Machine learning, Random forest, Traffic accidents, Injury severity scores
Copyright and License Information
© 2025 The Author(s).
This is an open access article distributed under the terms of the Creative Commons Attribution License (
http://creativecommons.org/licenses/by/4.0/), which permits unrestricted use, distribution, and reproduction in any medium, provided the original work is properly cited.
Funding Statement
The Road Traffic Injury Research Center, Tabriz University of Medical Sciences, Tabriz, Iran (grant number: 67193) provided funding for this study.
Introduction
Road Traffic Injuries (RTIs) are one of the most important threats to human life and are considered a public health problem worldwide. RTIs are the eighth-leading cause of death and are predicted to rise to become the fifth-leading cause of worldwide death by 2030. According to the Global Status Report on Road Safety (GSRRS) in 2018, disseminated by the World Health Organization (WHO), there was an annual death toll of 1.35 million and 20 to 50 million non-fatal injuries around the world.1 A high burden of road traffic deaths and injuries occur in low-and middle -income countries (LMICs).1 The Eastern Mediterranean Region (EMR) has the second-highest traffic-related death rate in the world.1 Iran has one of highest rates of RTIs in EMR, which has had severe effects on public health.2,3 RTIs are one of the most important causes of death in Iran, accounting for the second-leading cause of death.4,5
Road traffic accidents are avoidable and preventable.6 The availability of detailed RTIs data enables us to make future predictions and plan effective prevention strategies to tackle the problem. It is therefore of the greatest importance to predict RTIs to understand the pattern of the issue and identify the contributing factors to achieve the goals of preventing road traffic crashes and minimizing associated injuries. There are several ways to predict road traffic crashes. In the 80s and early 90s, statistical methods such as linear regression models were first used for the prediction of road crashes.7 Machine learning (ML) approaches have gained great interest in recent years.8
ML, highlighted as one of the most important advances of the 20th century has rapidly been used in a wide range of disciplines, including cancer prediction, cardiovascular diagnostics, image analysis,9-11 and in the prediction of road traffic crashes and death occurrence.12-16 ML refers to different computational approaches to teach computers to understand patterns from existing data and use such information to make future predictions.17 The main advantage of ML methods over other methods such as linear regression is that such approaches can relax the assumptions that are necessary for traditional regression models regarding multi-collinearity, additivity, and distribution.18
ML can employ multiple types of learning algorithms, of which logistic regression (LR), elastic net logistic regression (ENLR), decision trees (DT), random forests (RF), extreme gradient boosting (XGB), (linear and non-linear) support vector machines (SVM), and artificial neural networks (ANNs) are commonly used in medical disciplines.19 ENLR is a hybrid of ridge regression and LASSO regularization. Like the LASSO, ENLR can generate reduced models by generating zero-valued coefficients. Empirical studies have suggested that the Elastic Net technique can outperform LASSO on data with highly correlated predictors.20 DTs are the most straightforward algorithms that provides a visual representation of the relationship between the predictors and outcome variables. However, the variability in the DTs can, in some cases, can be improved by using XGB and RF, which aggregate the results of randomly generated DTs to produce a more effective model.21 SVMs are a set of supervised learning methods used for classification, regression, and outlier detection. SVMs are discriminative classifier that can be defined by separating linear or nonlinear hyperplanes which distinguish different classes.18 ANNs have been broadly used in medical studies.22 Such models perform well when there are complex and non-linear associations between variables.23
As discussed earlier, Iran has one of the highest rates of RTIs in EMR, which has severe effects on public health. This study aims to use ML algorithms to first understand the main causes of the deaths in accidents and second, to predict the occurrence of death in road accidents. This will be beneficial to the whole population and society in terms of safety, hospital proper resources allocation in the EMS.
Methods
Data and Population
The current cross-sectional study was conducted by the Declaration of Helsinki in East Azerbaijan province, Iran (which is situated in the northwestern part of the country with an area of approximately 47 830 km2 and around 4 000 000 inhabitants in 2022). We used data from 2017-03-19 to 2021-03-20 that registered in the RTIs by the East Azerbaijan Forensic Medicine Organization database (EAFMOD). Its injury records are mainly provided by police and hospital sources, and the death occurrence (outcome variable) was recorded (according to the WHO definition: deaths occurring within thirty days after RTIs are considered as traffic deaths) in the same day. Information on predictor variables was obtained from the Traffic Monitoring Cameras Data (TMCD).24 The Vehicle Tracking System is used to register the number of vehicles passing through each road, their speed, and violations. The main definition of an accident in this study is: any accident involving at least one road vehicle in motion on a public road or private road to which the public has the right of access, resulting in at least one injured or killed person. The total number of accident days was 1491. After applying the exclusion criteria (injuries that occurred in other provinces or deaths occurred after the 30th day), these cases were omitted from the data. The predictor variables in the current study are duration of surveillance cameras (min), total number of vehicles on the road (by class), the average of their speed and violations (km/h), number of illegal overtaking incidents, unsafe distance while driving, and total number of speeding violations. Vehicle Tracking System classifies the vehicles into five classes; Class 1: light duty, which includes passenger cars, light-duty pickup trucks, minivans, or vehicles with 4 tires only; Class 2: medium duty, which includes flatbed trucks, box trucks, extended bed cargo, small buses, and conversion vans; Class 3: three-axle single-unit trucks; Class 4: Buses; Class 5: heavy duty includes trailer or four or more Axle Single-Unit Trucks. Details of data collection have been published elsewhere.25 Also, in accordance with ethical standards, each subject in the project signed a detailed informed consent form.
Statistical Analysis
The quantitative variables were summarized as mean (SD) and median [min, max]. The qualitative variables were reported as number and percentage (%). A two independent sample t-test was used for the comparison between the two groups (death vs non-death), at a 0.05 level of significance. The Pearson correlation analysis was used to verify the association between the predictor variables.
Machine Learning Methodology
To develop ML prediction models, we followed the “Transparent Reporting of a Multivariable Prediction Model for Individual Prognosis or Diagnosis: the TRIPOD statement” for preparing, developing, and validating the statistical analysis and prediction models.26 Following that, in this study, we applied LR, ENLR, DTs, RFs, XGB, SVMs (linear and non-linear), and ANNs to predict death occurrence at the in road accident.
Handling Class Imbalance
Prediction algorithms typically tend to predict the majority class, resulting in incorrect sensitivities and specificities.27 Instead, addressing the imbalance in the outcomes (i.e., lower rates of one class) in the training data typically results in the development of a superior prediction model and a better trade-off between sensitivity and specificity. The most common technique to overcome imbalanced outcomes is oversampling the minority class and under-sampling the majority class.28 We use the random oversampling method, which was shown to be efficient in terms of speed and produced the most accurate results.29
Model Selection and Evaluation
We divided the data into two portions: 2/3 of the data was used for model building or training, while the remaining 1/3 of the data was used to test the model or validate it. For each of the ML algorithms, we used ten-fold cross-validation in the balanced training data to find the optimal model that produces the highest area under the receiver operator characteristic curve (AUC) in the training set. We assessed the model’s performance in the validation data in terms of some indices such as sensitivity, specificity, positive predictive value, negative predictive value, and AUC.30
We used R software (version 3.5.2) and the caret31 package to perform the ML algorithms. For variable selection in ML models, we used the RF variable importance measure to obtain the contribution of each variable in the occurrence of death. The higher the importance, the more predictive power in the model.32 We used the pROC package to develop the ROC curves.33
Results
Univariate Analysis
We examined 1491 days with TMCD (Traffic Monitoring Camera Data) information. Death occurred in 1227 (82%) days. Table 1 shows a comparison of the death and non-death days based on the camera information. The mean and median of the duration of surveillance cameras (min) differed between death and non-death days. We observed that the mean and median number of class 1 vehicles on the road for the days that death occurred was significantly higher than those days without death (mean: 559000 vs 521000). The same pattern was observed for type 2 (mean: 42300 vs 30300) and 4 (mean: 11800 vs 10400) vehicles. However, significantly opposite trends were observed for vehicle type 3 (mean: 22200 vs 24400) and type 5 (mean: 26600 vs 28100). Another significant difference between death and non-death days were the number of illegal overtaking (per day) vehicles (median difference: 1130 and mean difference: 1010). Refer to Table 1 for more comparisons.
Table 1.
Comparison of the death and non-death days based on the camera information
|
Variables
|
Death (n=1227)
|
Non-Death (n=264)
|
P
value*
|
Overall (N=1491)
|
| Duration of surveillance cameras (min) |
|
|
|
|
| Mean (SD) |
112000 (8700) |
111000 (6780) |
0.0013 |
112000 (8390) |
| Median [Min, Max] |
114000 [2880, 123000] |
112000 [64000, 121000] |
|
114000 [2880, 123000] |
| Number of vehicles on the road (per day) |
|
|
|
|
| Mean (SD) |
662000 (130000) |
614000 (122000) |
< 0.001 |
652000 (130000) |
| Median [Min, Max] |
664000 [1500, 1070000] |
643000 [117000, 930000] |
|
657000 [1500, 1070000] |
| Number of class 1 vehicles on the road |
|
|
|
|
| Mean (SD) |
559000 (119000) |
521000 (112000) |
< 0.001 |
551000 (119000) |
| Median [Min, Max] |
555000 [1320,963000] |
538000 [101000,805000] |
|
552000 [1320, 963000] |
| Number of class 2 vehicles on the road |
|
|
|
|
| Mean (SD) |
42300 (14000) |
30300 (12400) |
< 0.001 |
40000 (14500) |
| Median [Min, Max] |
42200 [89.0, 73600] |
27900 [3310, 77500] |
|
39100 [89.0, 77500] |
| Number of class 3 vehicles on the road |
|
|
|
|
| Mean (SD) |
22200 (5820) |
24400 (6120) |
< 0.001 |
22600 (5940) |
| Median [Min, Max] |
22400 [49.0, 37200] |
25200 [2350, 34700] |
|
22700 [49.0, 37200] |
| Number of class 4 vehicles on the road |
|
|
|
|
| Mean (SD) |
11800 (2920) |
10400 (2690) |
< 0.001 |
11600 (2940) |
| Median [Min, Max] |
12000 [29.0, 19700] |
10500 [739, 19700] |
|
11600 [29.0, 19700] |
| Number of class 5 vehicles on the road |
|
|
|
|
| Mean (SD) |
26600 (6460) |
28100 (6410) |
< 0.001 |
26900 (6480) |
| Median [Min, Max] |
27200 [17.0, 43500] |
29400 [2970, 40500] |
|
27500 [17.0, 43500] |
| Average speed of vehicles (km/h) |
|
|
|
|
| Mean (SD) |
77.1 (2.82) |
78.5 (2.21) |
< 0.001 |
77.4 (2.76) |
| Median [Min, Max] |
77.6 [60.5, 85.0] |
78.9 [63.5, 84.1] |
|
78.0 [60.5, 85.0] |
| Number of speeding violations |
|
|
|
|
| Mean (SD) |
42600 (20600) |
41600 (16100) |
0.272 |
42400 (19800) |
| Median [Min, Max] |
37500 [286, 105000] |
40400 [3520, 98400] |
|
38600 [286, 105000] |
| Number of unsafe distance while driving |
|
|
|
|
| Mean (SD) |
113000 (34500) |
115000 (36000) |
0.101 |
113000 (34800) |
| Median [Min, Max] |
110000 [195, 230000] |
121000 [8130, 238000] |
|
112000 [195, 238000] |
| Number of illegal overtaking (per day) |
|
|
|
|
| Mean (SD) |
3950 (2350) |
2940 (1460) |
< 0.001 |
3750 (2240) |
| Median [Min, Max] |
3910 [0, 21100] |
2780 [53.0, 14100] |
|
3590 [0, 21100] |
* Based on independent sample t-test.
Training Models and Results
We trained all machine algorithms on the balanced training data set using the SMOTE procedure (1757/1665 (1.05). The results are given in (Table 2, Figure 1).
Table 2.
Comparison of machine learning models in the balanced training data by SMOTE
|
|
RF
|
DT
|
ANN
|
SVML
|
SVMNL
|
LR
|
ENLR
|
XGB
|
| ROC.Min.1 |
0.90 |
0.64 |
0.50 |
0.73 |
0.65 |
0.74 |
0.74 |
0.83 |
| ROC.1st.Qu.2 |
0.92 |
0.72 |
0.74 |
0.77 |
0.78 |
0.78 |
0.80 |
0.85 |
| ROC.Median3 |
0.93 |
0.76 |
0.77 |
0.79 |
0.82 |
0.81 |
0.82 |
0.86 |
| ROC.Mean4 |
0.92 |
0.76 |
0.75 |
0.78 |
0.80 |
0.80 |
0.81 |
0.87 |
| ROC.3rd.Qu.5 |
0.93 |
0.81 |
0.79 |
0.80 |
0.84 |
0.83 |
0.82 |
0.89 |
| ROC.Max.6 |
0.94 |
0.86 |
0.85 |
0.82 |
0.87 |
0.85 |
0.83 |
0.90 |
| Sens.Min.7 |
0.39 |
0.16 |
0.00 |
0.00 |
0.30 |
0.29 |
0.22 |
0.39 |
| Sens.1st.Qu.8 |
0.47 |
0.32 |
0.17 |
0.02 |
0.41 |
0.30 |
0.26 |
0.54 |
| Sens.Median9 |
0.52 |
0.35 |
0.49 |
0.12 |
0.50 |
0.36 |
0.30 |
0.54 |
| Sens.Mean10 |
0.53 |
0.36 |
0.38 |
0.13 |
0.48 |
0.38 |
0.30 |
0.54 |
| Sens.3rd.Qu.11 |
0.57 |
0.41 |
0.55 |
0.23 |
0.52 |
0.45 |
0.34 |
0.58 |
| Sens.Max.12 |
0.70 |
0.49 |
0.66 |
0.30 |
0.68 |
0.57 |
0.38 |
0.66 |
| Spec.Min.13 |
0.97 |
0.94 |
0.87 |
0.98 |
0.95 |
0.93 |
0.95 |
0.96 |
| Spec.1st.Qu.14 |
0.98 |
0.97 |
0.92 |
0.99 |
0.97 |
0.97 |
0.97 |
0.97 |
| Spec.Median15 |
0.99 |
0.97 |
0.95 |
1.00 |
0.98 |
0.97 |
0.98 |
0.97 |
| Spec.Mean16 |
0.99 |
0.98 |
0.95 |
0.99 |
0.97 |
0.97 |
0.98 |
0.98 |
| Spec.3rd.Qu.17 |
0.99 |
0.99 |
0.98 |
1.00 |
0.98 |
0.99 |
0.99 |
0.98 |
| Spec.Max.18 |
0.99 |
1.00 |
1.00 |
1.00 |
0.99 |
0.99 |
1.00 |
0.99 |
1Minimum value of Receiver operating characteristic curve, 2First quantile value of Receiver operating characteristic curve, 3Median value of Receiver operating characteristic curve, 4Mean value of Receiver operating characteristic curve, 5Third quantile value of Receiver operating characteristic curve, 6Maximim value of Receiver operating characteristic curve, 7Minimum value of sensitivity, 8First quantile value of sensitivity, 9Median value of sensitivity, 10Mean value of sensitivity, 11Third quantile value of sensitivity, 12Maximum value of sensitivity, 13Minimum value of specificity, 14First quantile value of specificity, 15Median value of specificity, 16Mean value of specificity, 17Third quantile value of specificity, 18Maximum value of specificity.
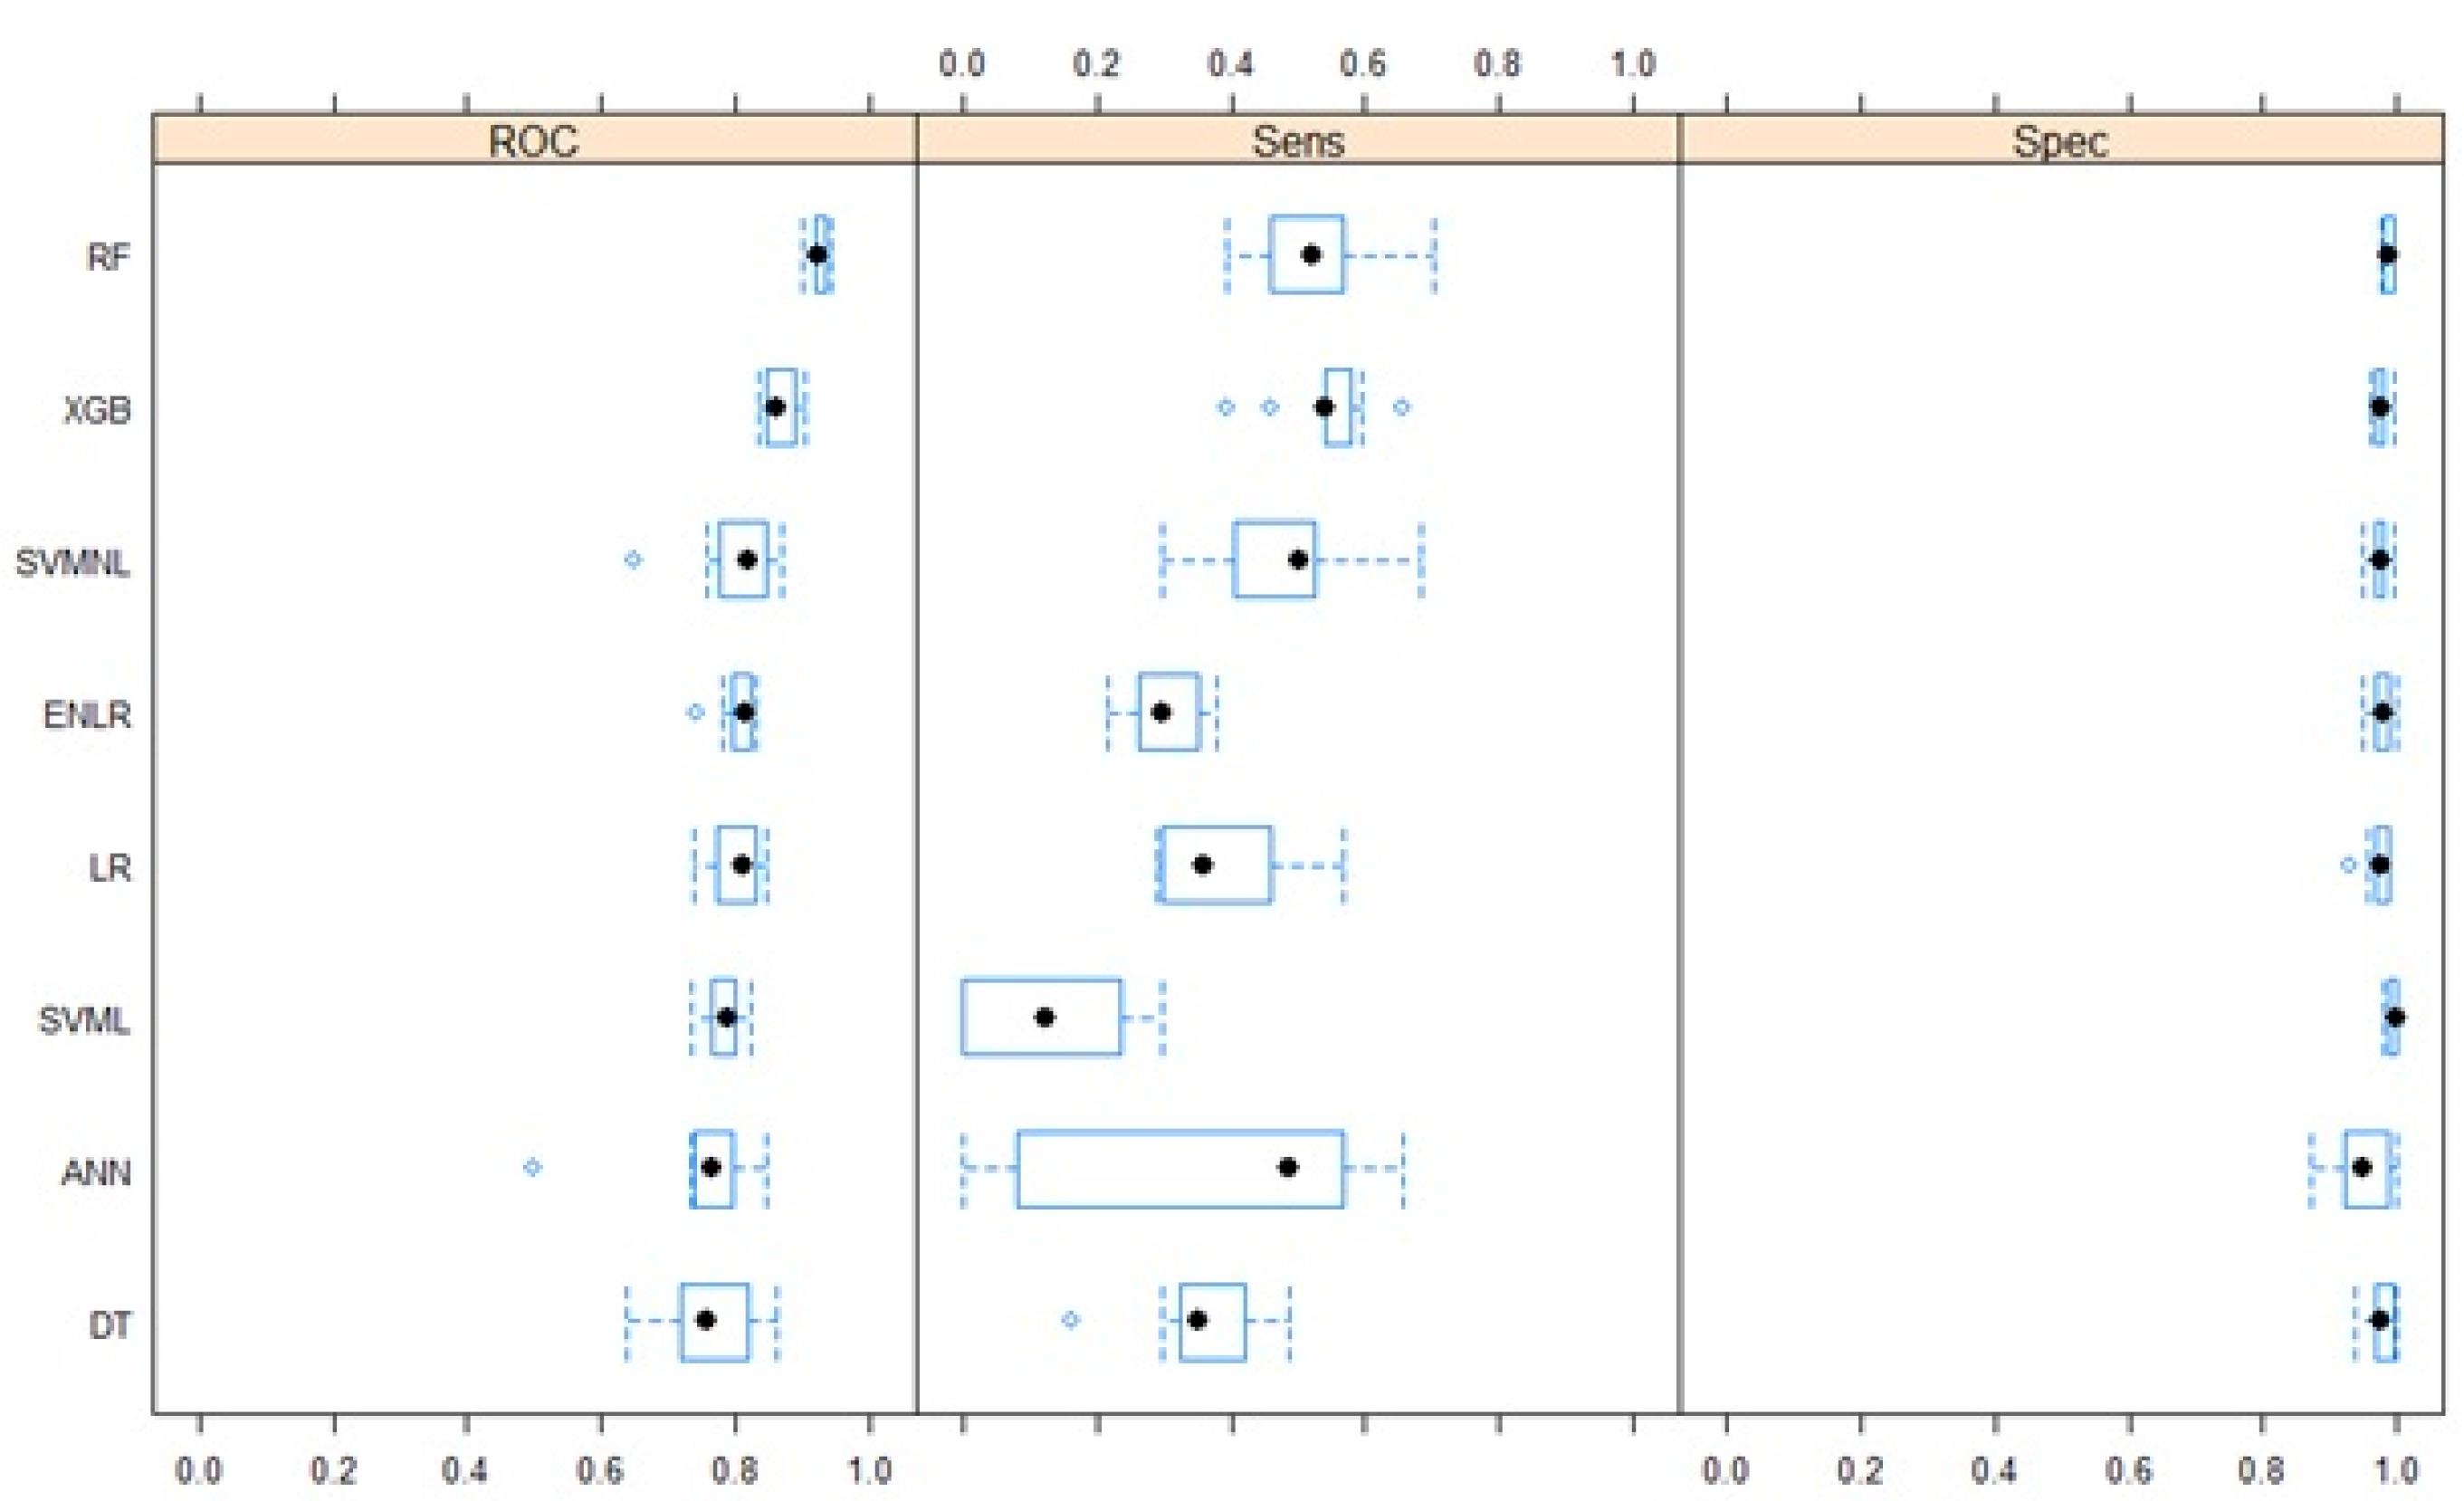
Figure 1.
Performance of the prediction models in the training data by SMOTE (DT: decision tree, ANN: artificial neural network, SVML: linear support vector machine learning, LR: logistic regression, ENLR: Elastics net logistic regression, SVMNL: non- linear support vector machine learning, XGB: extreme gradient Boosting, RF: random forest)
.
Performance of the prediction models in the training data by SMOTE (DT: decision tree, ANN: artificial neural network, SVML: linear support vector machine learning, LR: logistic regression, ENLR: Elastics net logistic regression, SVMNL: non- linear support vector machine learning, XGB: extreme gradient Boosting, RF: random forest)
The RF algorithm had the highest performance in terms of the minimum (0.90), maximum (0.94) and quartiles (0.92, 0.93, and 0.93) of the AUC followed by the XGB: minimum (0.83), maximum (0.90) and quartiles (0.85, 0.89, and 0.90. In terms of the average AUCs, ENLR (0.81) and LR (0.80) had better performance compared to the DTs (0.76) and ANNs (0.75).
Testing Models and Results
The validation data included 803 occurrences of which 651 (0.81%) were deaths. Table 3 shows performance measures (such as sensitivity, specificity, positive predictive value, negative predictive value) of RF model on the testing data.
Like the training data, RF had the highest AUC (Figure 2: (AUC: 0.91; 95% CI: 0.88-0.93), sensitivity: 0.53 and specificity: 0.97 (Table 3).
Table 3.
Performance measure of random forest model in testing data
|
Measures
|
Values
|
| Sensitivity |
0.53 |
| Specificity |
0.97 |
| Positive predictive value |
0.79 |
| Negative predictive value |
0.90 |
| Precision |
0.79 |
| Accuracy |
0.88 |
| Kappa |
0.56 |
| Prevalence |
0.19 |
| Detection rate |
0.10 |
| Detection prevalence |
0.13 |
| Balanced accuracy |
0.75 |
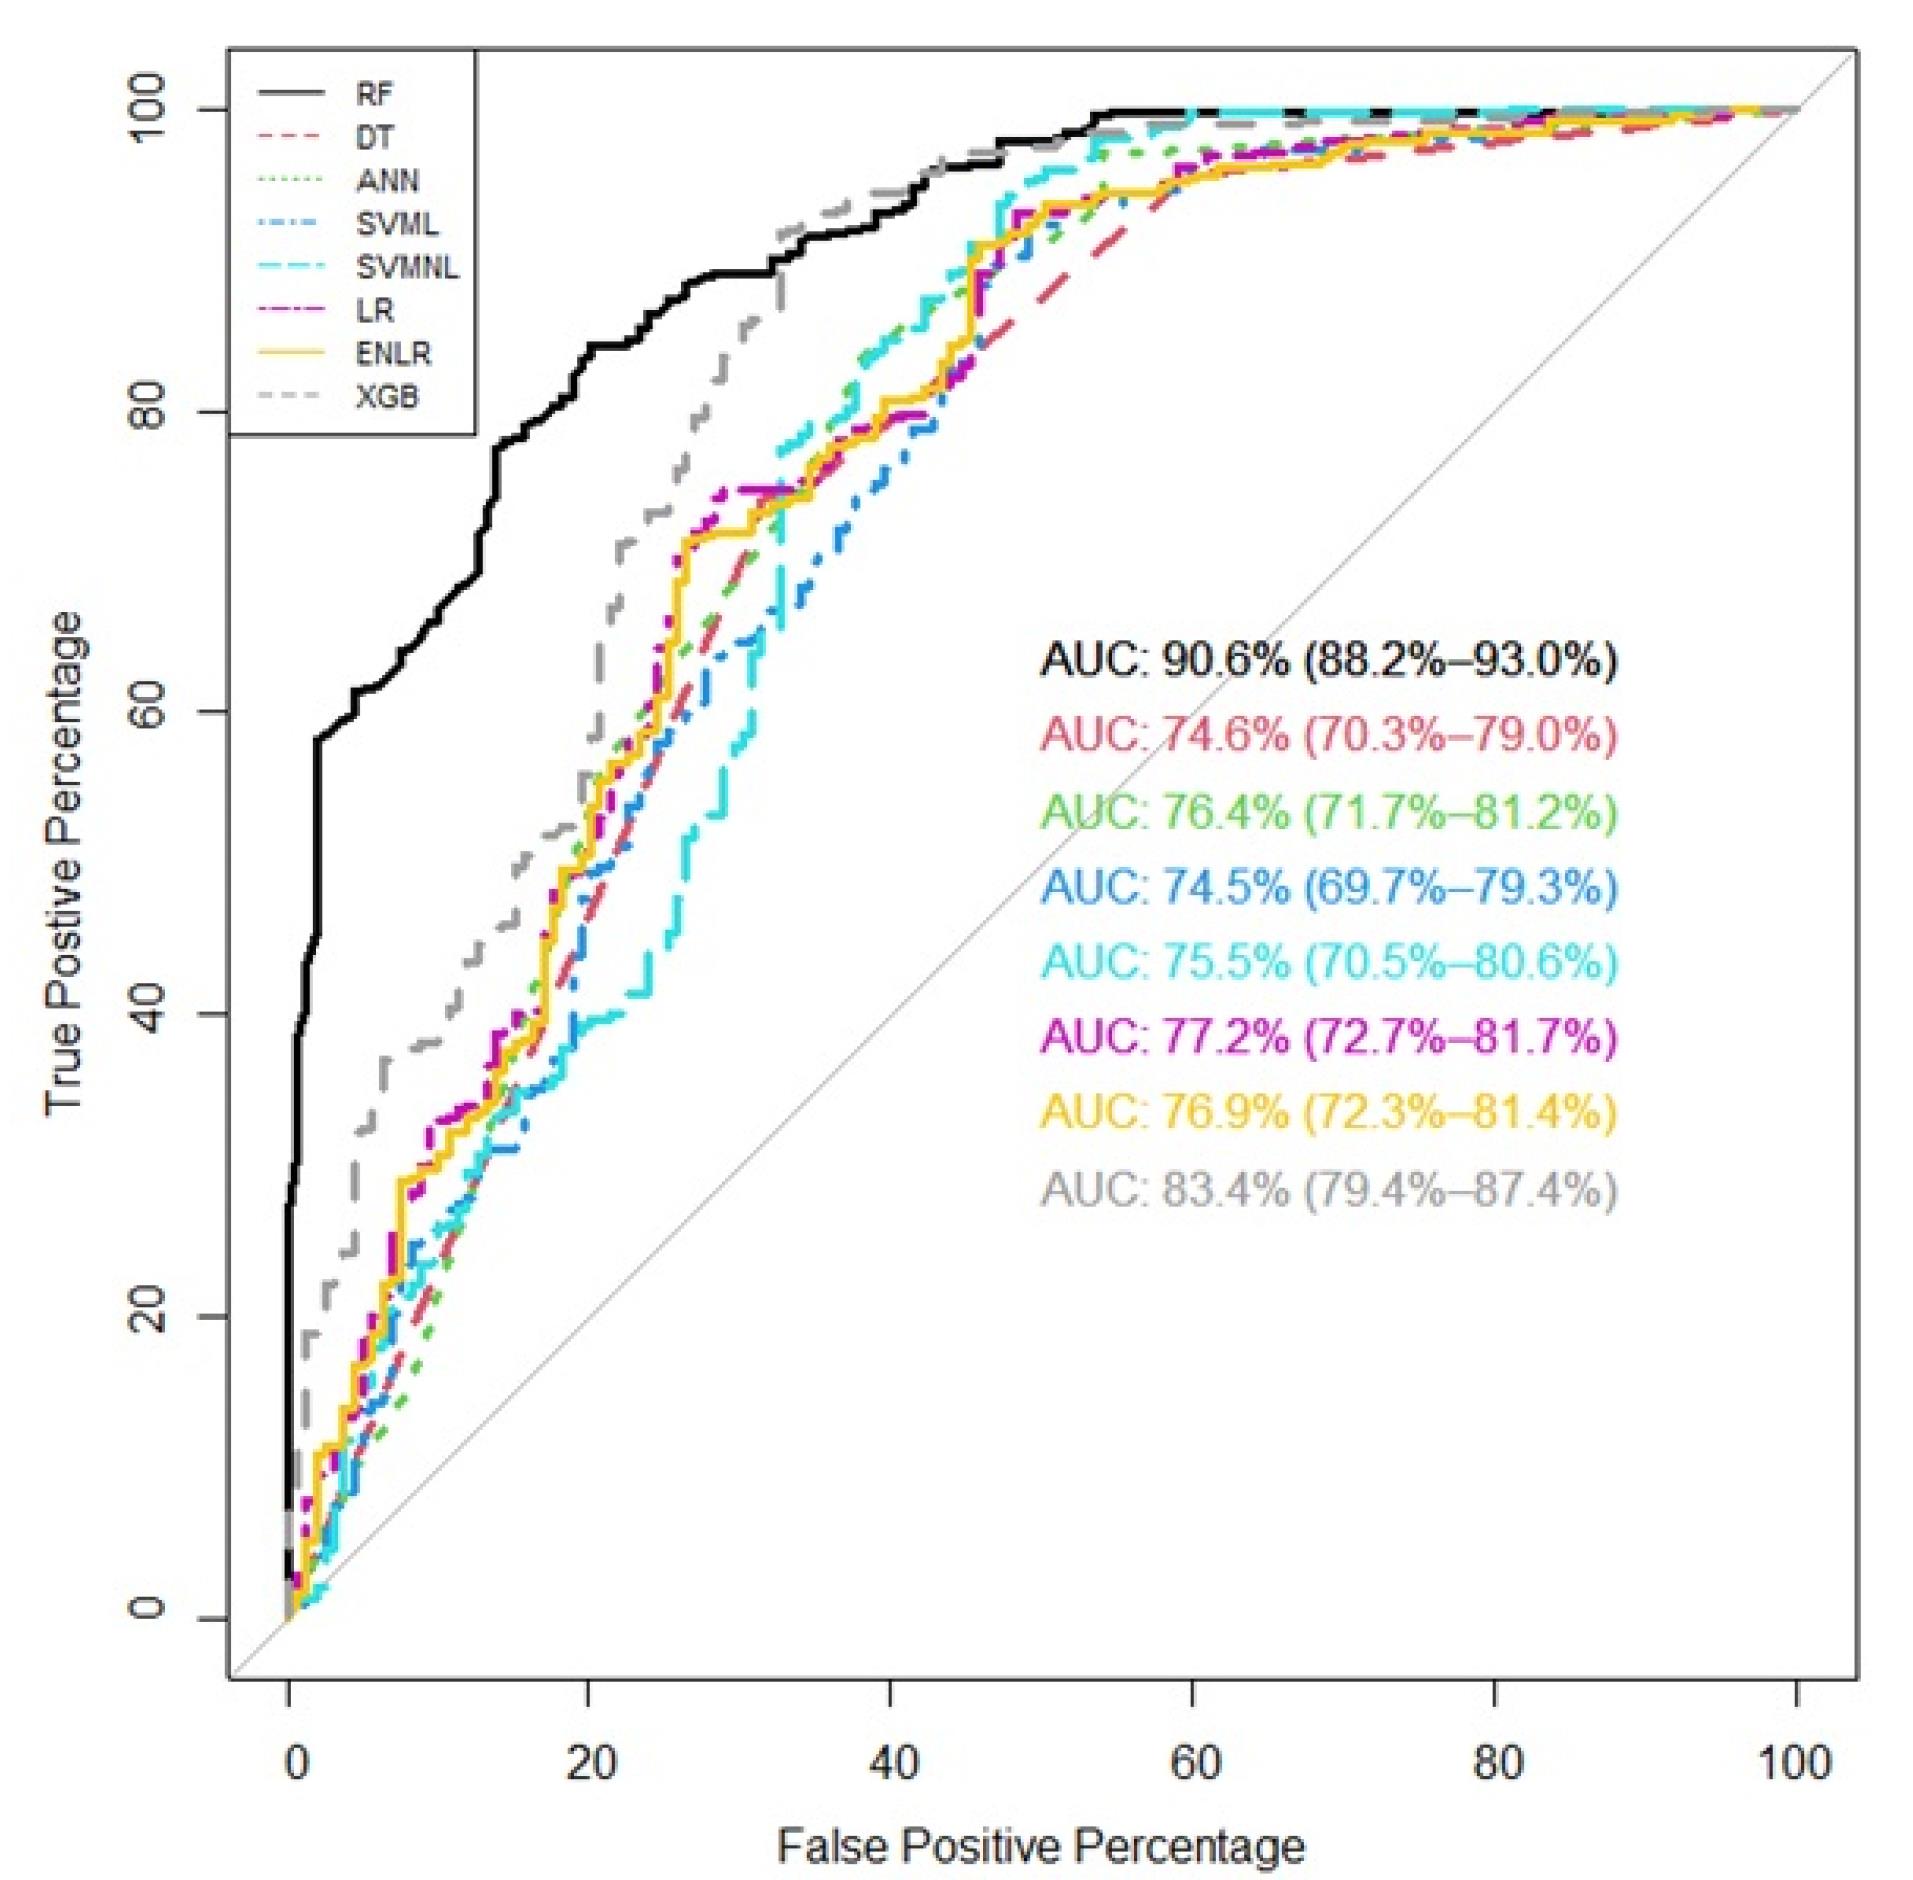
Figure 2.
Area under the curve for all prediction models in the testing data (DT: decision tree, ANN: artificial neural network, SVML: linear support vector machine learning, LR: logistic regression, ENLR: Elastics net logistic regression, SVMNL: non- linear support vector machine learning, XGB: extreme gradient Boosting, RF: random forest)
.
Area under the curve for all prediction models in the testing data (DT: decision tree, ANN: artificial neural network, SVML: linear support vector machine learning, LR: logistic regression, ENLR: Elastics net logistic regression, SVMNL: non- linear support vector machine learning, XGB: extreme gradient Boosting, RF: random forest)
The model’s accuracy was 0.88, which is considered excellent. The higher the accuracy, the better the performance of the model at distinguishing between the positive and negative classes.
The variable importance using RF is given in Table 4 and Figure 3. The total number of type 2 vehicles on the roads was the most important predictor variable (overall importance: 83.95), followed by unsafe driving distances (58.50).
Table 4.
Variable importance by random forest model
|
Variables
|
Overall importance
|
| Number of class 2 vehicles |
83.95 |
| Number of unsafe distance while driving |
58.50 |
| Number of class 4 vehicles |
56.58 |
| Average speed of vehicles (km/h) |
56.31 |
| Number of illegal overtaking |
54.98 |
| Number of the total vehicles on the road |
50.50 |
| Number of class 1 vehicles |
49.58 |
| Duration of surveillance cameras (min) |
47.77 |
| Number of speeding violations |
47.30 |
| Number of class 3 vehicles |
45.05 |
| Number of class 5 vehicles |
43.72 |
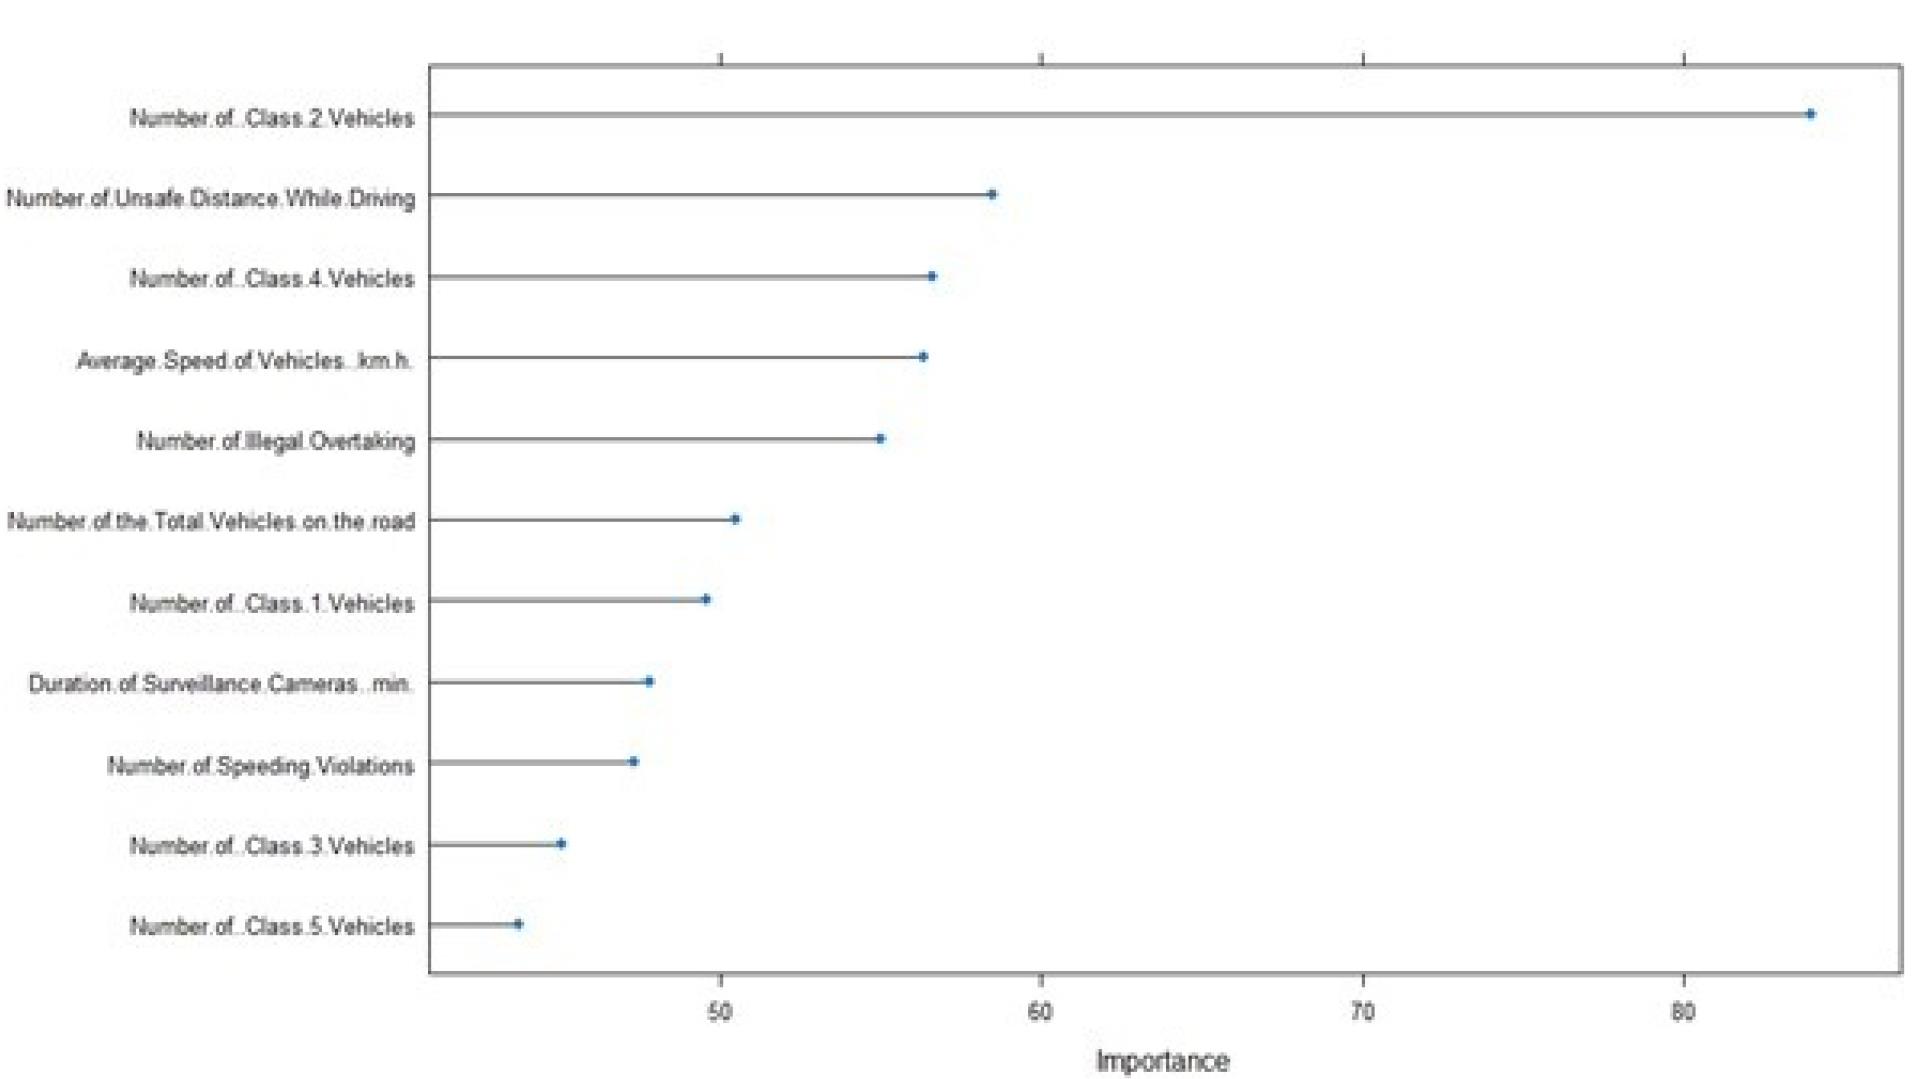
Figure 3.
Variable Importance by random forest for the prediction of the occurrence of death
.
Variable Importance by random forest for the prediction of the occurrence of death
The number of class 4 vehicles (56.58%) and average vehicle speed (56.31%) were the next most important variables.
Furthermore, a heatmap plot was employed to identify patterns and correlations among predictor variables (Figure 4). This plot depicted values for Pearson correlation across two axes variables as a grid of colored squares. Darker colors indicate stronger correlations, while lighter colors indicate weaker correlations. Positive correlations (when one variable increases, the other variable tends to increase) are represented by warm colors (red). Negative correlations (when one variable increases, the other variable tends to decrease) are represented by cool color (blue). Statistically non-significant correlations are displayed as empty cells.
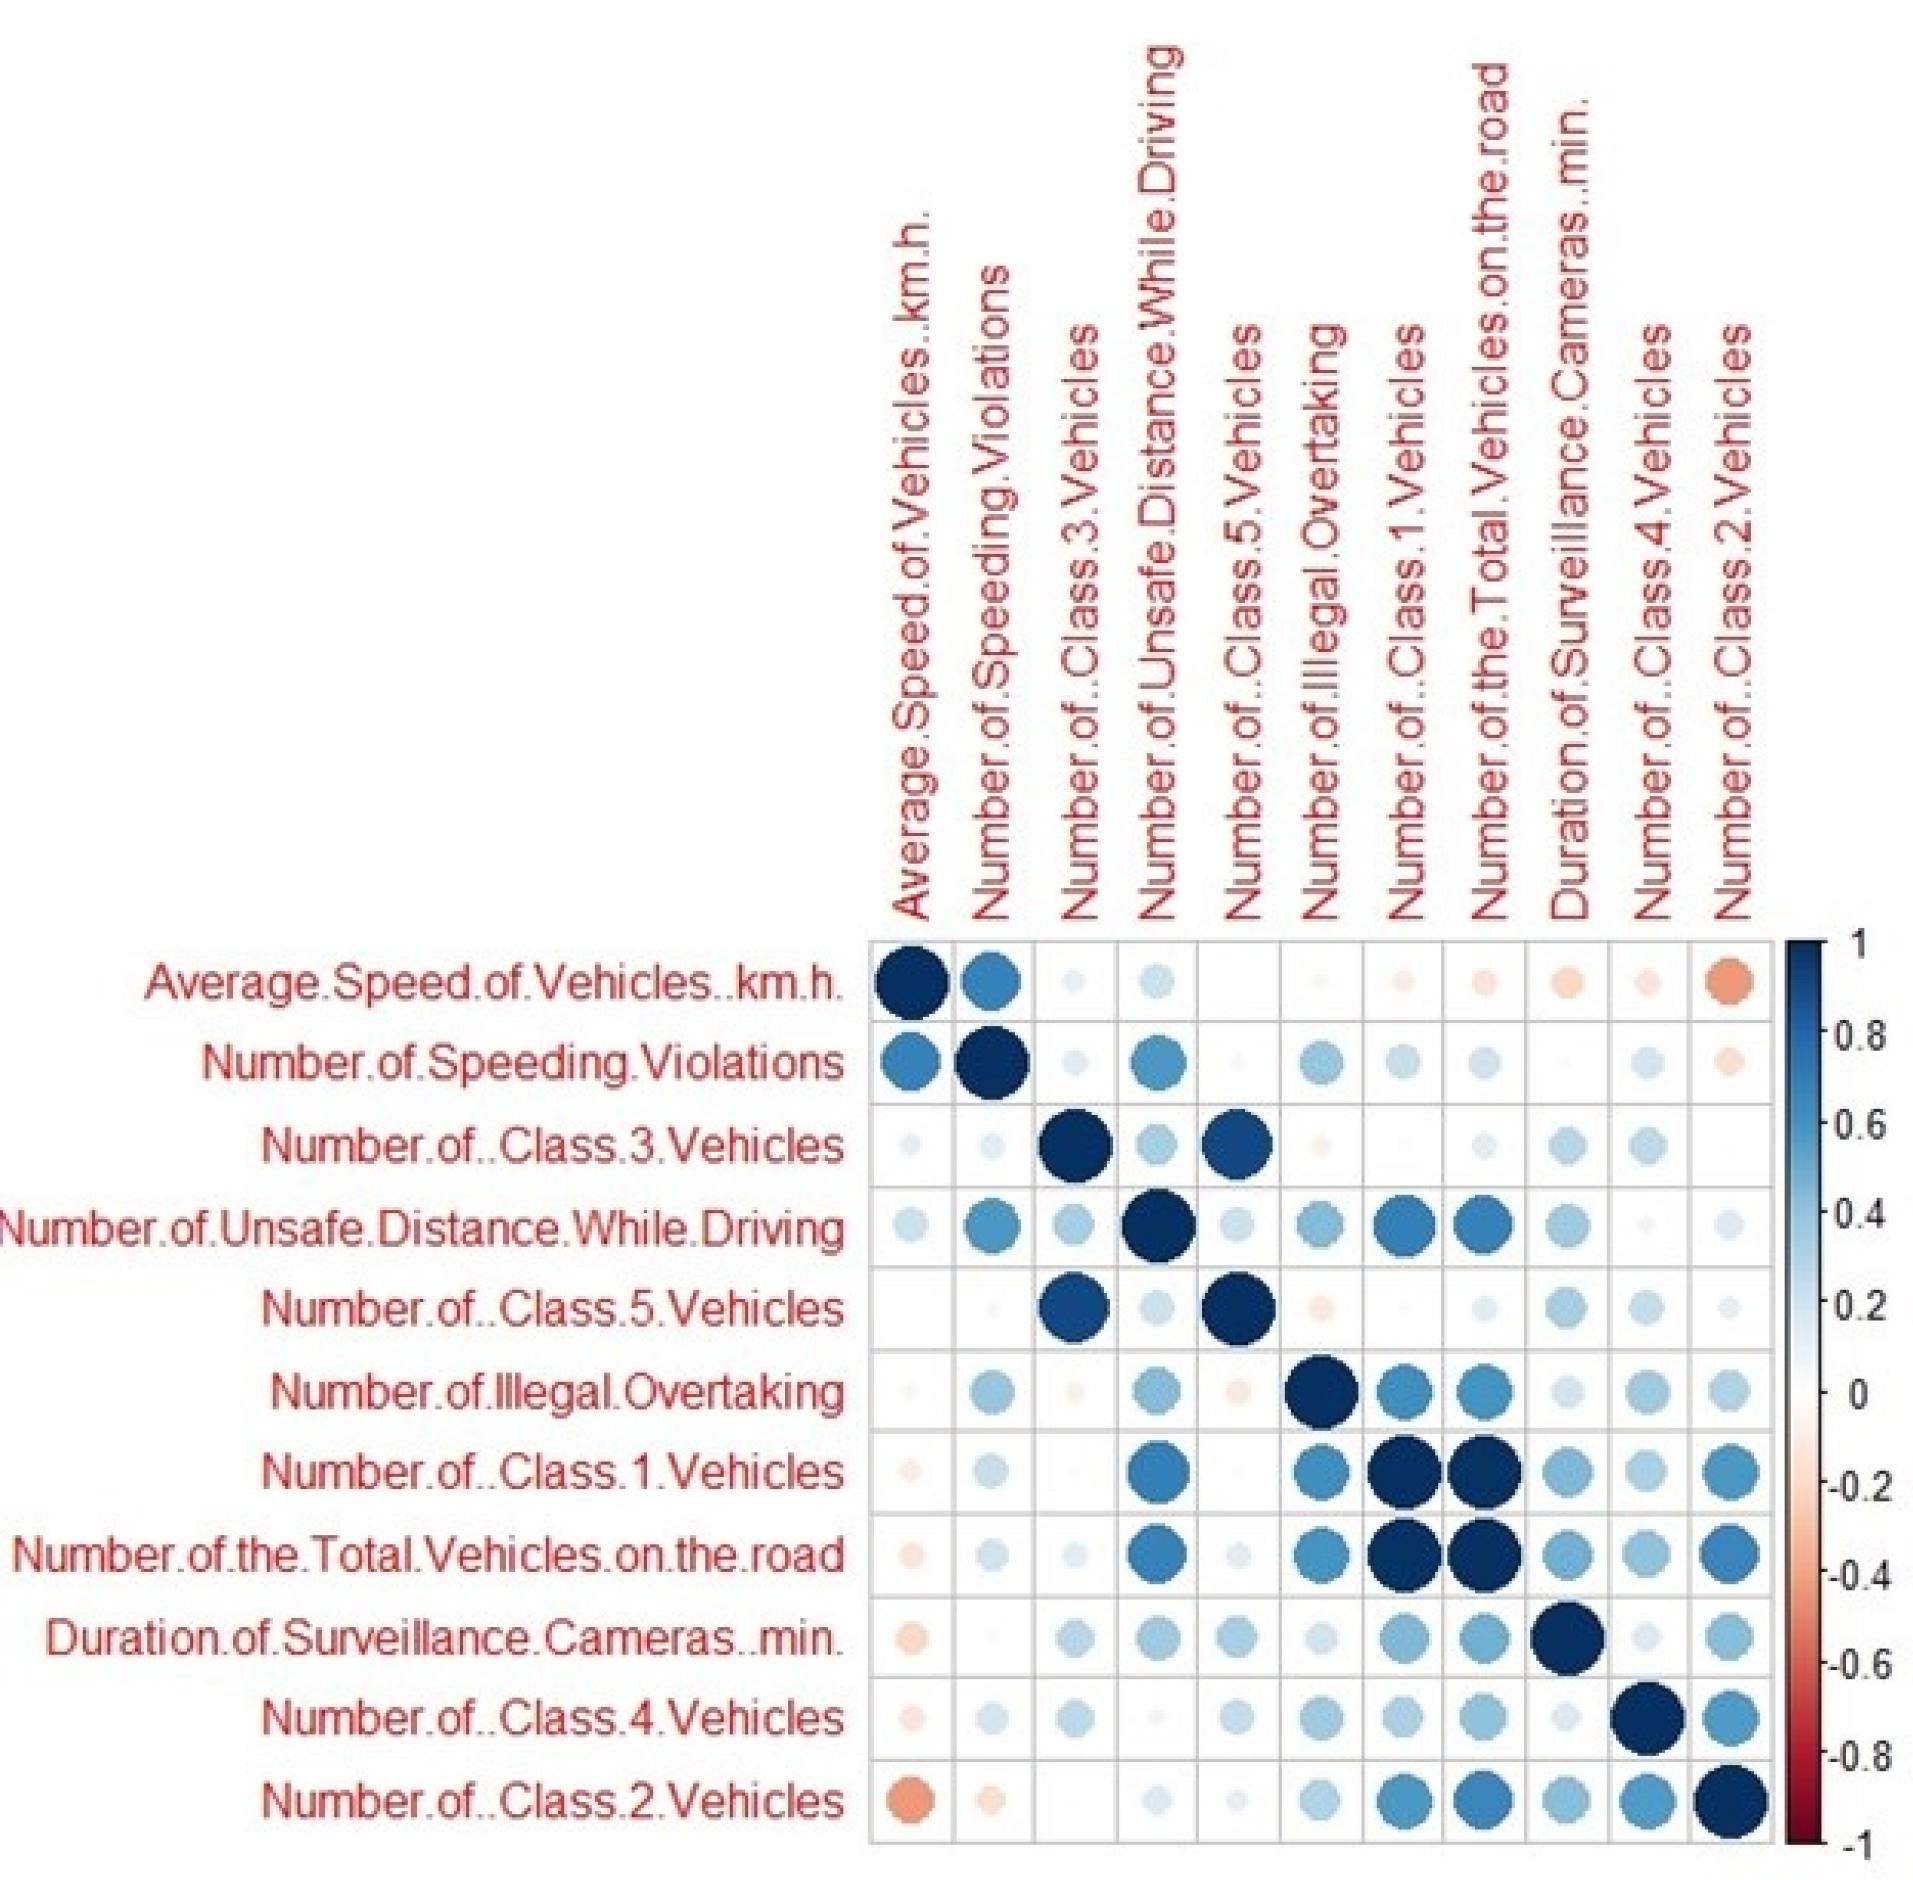
Figure 4.
Heatmap of the predictor variables. Darker colors indicate stronger correlations, while lighter colors indicate weaker correlations. Positive correlations (when one variable increases, the other variable tends to increase) are represented by warm color (red). Negative correlations (when one variable increases, the other variable tends to decrease) are represented by cool color (blue)
.
Heatmap of the predictor variables. Darker colors indicate stronger correlations, while lighter colors indicate weaker correlations. Positive correlations (when one variable increases, the other variable tends to increase) are represented by warm color (red). Negative correlations (when one variable increases, the other variable tends to decrease) are represented by cool color (blue)
The XGB had the second highest AUC (0.83; 95% CI: 0.79-0.87). The other models provided lower AUCs (the results are not reported here).
Discussion
Fatalities in road accidents are a serious issue in Iran. Predicting the occurrence of road traffic deaths and identifying the contributing factors enable experts, authorities, and researchers to understand the extent of the issue and speed up the decision-making to tackle it. In current study, we used several state of the art ML algorithms to predict the occurrence of death in East Azerbaijan province road accidents based on data from traffic monitoring cameras. The findings of this study, which used eight models of LR, ENLR, DTs, RFs, XGB, (linear and non-linear) SVM, and ANNs to determine the most effective prediction model for occurrence of road traffic deaths and to explore the importance factors. It was observed that the RF model outperformed the other ML algorithms followed by the XGB method. Based on the performance measures, it was shown that the RF model has greater value in sensitivity, specificity, and accuracy in predicting deaths compared to other ML approaches. RF is a supervised classification algorithm that was first proposed by Leo Breiman and Adele Cutler. In RF, sampling is done randomly with replacement, and training progress by combining multiple DTs.34 There are several studies that have applied the RF along with the other methods to predict the road traffic crashes and related injuries.12,35,36 The findings of a study that used three models of LR, Classification and Regression Tree (CART), and RF to determine the most effective prediction model for road traffic severity injury and exploring the correlated factors, showed that the RF is the most efficient tool.35 In another study, tree-based ensemble models including RF, AdaBoost, Extra Tree, and Gradient Boosting, and an ensemble of two statistical models including LR stochastic gradient descent, were compared for the prediction of road accident severity. The results of this study showed the RF as the best performing model.37 One reason that makes RF as a superior model, is that the RF can handle the correlated predictor variables, non-linear interactions and structures which goes beyond the capabilities of the statistical models.21
On the other hand, exploring the important factors associated with deaths in road accidents is one of the main interests among researchers. In the current study, the variables of “number of Class 2 vehicles”, “number of unsafe distance while driving”, “number of Class 4 vehicles”, and “average speed of vehicles” were identified as important variables. The number of vehicles determines the level of traffic congestion. Traffic congestion and its association with road safety is an important issue that is an ongoing debate among some transport planners and policy makers. Some believe that the increased level of traffic congestion leads to a decrease in the average traffic speed and this situation aids road safety. On the other hand, there are some other factors such as traffic flow, driver characteristics, road geometry, and vehicle type that affect road traffic crash occurrence and related injuries.38,39 The results of a study showed that increased the number of vehicles and traffic congestion does not affect the severity of road crashes.38
Speeding is violation is one of key risk factors in RTIs. The speed management decreases the number of fatalities, serious injuries, and death in traveling vehicles.1 The existence of a national speed limit law and speed limits not exceeding 50 km/h in the urban area are the best practices criteria that can help reduce the RTIs. In Iran, there is a speed limit low of 60 Km/h in urban area which is higher than the speed limit introduced by WHO and the enforcement of that is not satisfactory.1 The results of a study showed that driving offenses such as illegal overtaking, which is recognized as an important factor in the current study, vary according to temporal effects such as time of day and day of the week.40
Limitations
The results of this study strongly depend on the accuracy of the data collection tool, such as the TMCD accuracy. Although, the validity and confidence level of the tools has not been evaluated yet by the national experts in the Forensic Medicine Organization, However, a recently published research protocol provides more details on the reliability of the data collection methods used in this paper.25 Also, due to the legal restrictions in the Iran, death during transfer due to RTIs as well as deaths at the scene of accident have no meaning and are called hospital death. Nonetheless, the prediction power of our model was high enough (91% AUC) for practical use. But we still suggest further study to consider age, stage, and other unrecognized factors associated with death that has not included in the current paper. Also, we restricted our analysis to death variable, and we did not evaluate the severity of injuries for non-death cases. Thus, we suggested other studies to include multiple categories in the prediction models rather than just death and non-death.
Study Highlights
What is current knowledge?
What is new here?
-
Applied multiple machine learning algorithms to traffic monitoring camera data.
-
Random forest model achieved the highest predictive accuracy (AUC 91%).
-
Identified key predictors of death: class 2 vehicles, unsafe driving distance, class 4 vehicles, and average vehicle speed.
-
Demonstrated that artificial intelligence can effectively use camera data to predict and potentially prevent road traffic fatalities.
Conclusion
Using the RF machine learning algorithm, the occurrence of death in accidents can be predicted with very high accuracy using the number of class 2 vehicles, number of unsafe distance while driving, number of class 4 vehicles, and average speed of vehicles.
Competing Interests
The authors declare that they have no competing interests with respect to the contents of this manuscript.
Consent to Publication
Not applicable.
Data Availability Statement
The datasets analysed during the current study are not publicly available because the utilized data were registered in the Forensic Medicine Organization, and they do not belong to the researchers of this study but are available from the corresponding author on reasonable request.
Ethical Approval
This study was approved by Road Traffic Injury Research Centre, as well as the regional committee of ethics in Tabriz University of Medical Sciences, with ethics confirmation under number IR. TBZMED.REC.1399.1181. All methods, measures and also how to collect information in this study have been done in accordance with the relevant instructions and regulations. Since this information is secondary data, so the permission to use them from the Forensic Medicine Organization has been obtained from the relatives of the subjects, and this team used this information based on this ethical consideration.
Acknowledgements
The authors would like to acknowledge the Integrated Road Traffic Injury Registry research group members who are not listed as authors to this publication.The research protocol of this study was approved and supported by Tabriz University of Medical Sciences (grant no. 67193).
References
- World Health Organization (WHO). Global Status Report on Road Safety 2018. WHO; 2018.
- Shams Vahdati S, Ghaffarzad A, Rahmani F, Panahi F, Omrani Rad A. Patterns of road traffic accidents in north west of Iran during 2013 New Year Holidays: complications and casualties. Bull Emerg Trauma 2014; 2(2):82-5. [ Google Scholar]
- Gholipour C, Samadi Rad, Shams Vahdati S, Fahimi R, Ghaffarzad A, Moslehi Far L. Assessment of causes of preventable deaths in pre-hospital settings. J Clin Pract Res 2016; 38(2):66-9. doi: 10.5152/etd.2016.0055 [Crossref] [ Google Scholar]
- Shavaleh R, Motevalian SA, Mahdavi N, Haddadi M, Mohaghegh MR, Hamedi Z. Epidemiological study of hospitalized road traffic injuries in Iran 2011. Med J Islam Repub Iran 2018; 32:50. doi: 10.14196/mjiri.32.50 [Crossref] [ Google Scholar]
- Gholipour C, Shams Vahdati S, Notash M, Miri SH, Rajaei Ghafouri R. success rate of pre-hospital emergency medical service personnel in implementing pre hospital trauma life support guidelines on traffic accident victims. Turk J Emerg Med 2014; 14(2):71-4. doi: 10.5505/1304.7361.2014.50103 [Crossref] [ Google Scholar]
- Razzaghi A, Soori H, Kavousi A, Abadi A, Khosravi A, Alipour A. Risk factors of deaths related to road traffic crashes in World Health Organization regions: a systematic review. Arch Trauma Res 2019; 8(2):57-86. doi: 10.4103/atr.atr_59_19 [Crossref] [ Google Scholar]
- Joshua SC, Garber NJ. Estimating truck accident rate and involvements using linear and Poisson regression models. Transp Plann Technol 1990; 15(1):41-58. doi: 10.1080/03081069008717439 [Crossref] [ Google Scholar]
- Ghandour AJ, Hammoud H, Al-Hajj S. Analyzing factors associated with fatal road crashes: a machine learning approach. Int J Environ Res Public Health 2020; 17(11):4111. doi: 10.3390/ijerph17114111 [Crossref] [ Google Scholar]
- Kourou K, Exarchos TP, Exarchos KP, Karamouzis MV, Fotiadis DI. Machine learning applications in cancer prognosis and prediction. Comput Struct Biotechnol J 2015; 13:8-17. doi: 10.1016/j.csbj.2014.11.005 [Crossref] [ Google Scholar]
- Jalali A, Simpao AF, Gálvez JA, Licht DJ, Nataraj C. Prediction of periventricular leukomalacia in neonates after cardiac surgery using machine learning algorithms. J Med Syst 2018; 42(10):177. doi: 10.1007/s10916-018-1029-z [Crossref] [ Google Scholar]
- Gilani N, Arabi Belaghi R, Aftabi Y, Faramarzi E, Edgünlü T, Somi MH. Identifying potential miRNA biomarkers for gastric cancer diagnosis using machine learning variable selection approach. Front Genet 2021; 12:779455. doi: 10.3389/fgene.2021.779455 [Crossref] [ Google Scholar]
- Dogru N, Subasi A. Traffic accident detection using random forest classifier. In: 2018 15th Learning and Technology Conference (L&T). Jeddah, Saudi Arabia: IEEE; 2018. doi: 10.1109/lt.2018.8368509.
- Silva PB, Andrade M, Ferreira S. Machine learning applied to road safety modeling: a systematic literature review. J Traffic Transp Eng 2020; 7(6):775-90. doi: 10.1016/j.jtte.2020.07.004 [Crossref] [ Google Scholar]
- Bedane TT, Assefa BG, Mohapatra SK. Preventing traffic accidents through machine learning predictive models. In: 2021 International Conference on Information and Communication Technology for Development for Africa (ICT4DA). Bahir Dar, Ethiopia: IEEE; 2021. p. 36-41. doi: 10.1109/ict4da53266.2021.9672249.
- Jafari SA, Jahandideh S, Jahandideh M, Barzegari Asadabadi E. Prediction of road traffic death rate using neural networks optimised by genetic algorithm. Int J Inj Contr Saf Promot 2015; 22(2):153-7. doi: 10.1080/17457300.2013.857695 [Crossref] [ Google Scholar]
- Shams Vahdati S, Ojaghi Haghighi SH, Paknejad P, Fahimi R, Tajoddini S. One-year evaluation of trauma patients’ death. J Emerg Pract Trauma 2016; 2(2):31-2. doi: 10.15171/jept.2016.07 [Crossref] [ Google Scholar]
- Alpaydin E. Introduction to Machine Learning. MIT Press; 2020.
- Hastie T, Tibshirani R, Friedman JH, Friedman JH. The Elements of Statistical Learning: Data Mining, Inference, and Prediction. New York: Springer; 2009.
- Wiemken TL, Kelley RR. Machine learning in epidemiology and health outcomes research. Annu Rev Public Health 2020; 41:21-36. doi: 10.1146/annurev-publhealth-040119-094437 [Crossref] [ Google Scholar]
- Zou H, Hastie T. Regularization and variable selection via the elastic net. J R Stat Soc Series B Stat Methodol 2005; 67(2):301-20. doi: 10.1111/j.1467-9868.2005.00503.x [Crossref] [ Google Scholar]
- James G, Witten D, Hastie T, Tibshirani R. An Introduction to Statistical Learning: With Applications in R. New York: Springer; 2013.
- DeGregory KW, Kuiper P, DeSilvio T, Pleuss JD, Miller R, Roginski JW. A review of machine learning in obesity. Obes Rev 2018; 19(5):668-85. doi: 10.1111/obr.12667 [Crossref] [ Google Scholar]
- Hassanipour S, Ghaem H, Arab-Zozani M, Seif M, Fararouei M, Abdzadeh E. Comparison of artificial neural network and logistic regression models for prediction of outcomes in trauma patients: a systematic review and meta-analysis. Injury 2019; 50(2):244-50. doi: 10.1016/j.injury.2019.01.007 [Crossref] [ Google Scholar]
- Sadeghi-Bazargani H, Sadeghpour A, Lowery Wilson M, Ala A, Rahmani F. Developing a national integrated road traffic injury registry system: a conceptual model for a multidisciplinary setting. J Multidiscip Healthc 2020; 13:983-96. doi: 10.2147/jmdh.S262555 [Crossref] [ Google Scholar]
- Samadirad B, Khodadoost M, Sadeghi-Bazargani H, Shahedifar N, Heydari ST, Gholamzadeh S. Epidemiology of fatal traffic injuries registered in East Azerbaijan and Fars forensic medicine organizations: the research protocol. J Clin Res Govern 2016; 5(1):e193. doi: 10.13183/jcrg.v5i1.193 [Crossref] [ Google Scholar]
- Moons KG, Altman DG, Reitsma JB, Ioannidis JP, Macaskill P, Steyerberg EW. Transparent reporting of a multivariable prediction model for individual prognosis or diagnosis (TRIPOD): explanation and elaboration. Ann Intern Med 2015; 162(1):W1-73. doi: 10.7326/m14-0698 [Crossref] [ Google Scholar]
- Johnson JM, Khoshgoftaar TM. Survey on deep learning with class imbalance. J Big Data 2019; 6(1):27. doi: 10.1186/s40537-019-0192-5 [Crossref] [ Google Scholar]
- Sun Y, Wong AK, Kamel MS. Classification of imbalanced data: a review. Intern J Pattern Recognit Artif Intell 2009; 23(04):687-719. doi: 10.1142/s0218001409007326 [Crossref] [ Google Scholar]
- Shanab AA, Khoshgoftaar TM, Wald R, Napolitano A. Impact of noise and data sampling on stability of feature ranking techniques for biological datasets. In: 2012 IEEE 13th International Conference on Information Reuse & Integration (IRI). Las Vegas, NV: IEEE; 2012. p. 415-22. doi: 10.1109/iri.2012.6303039.
- Hosmer DW Jr, Lemeshow S, Sturdivant RX. Applied Logistic Regression. John Wiley & Sons; 2013.
- Kuhn M, Wing J, Weston S, Williams A, Keefer C, Engelhardt A, et al. caret: Classification and Regression Training. R Package Version 6.0-86. Cambridge, MA: Astrophysics Source Code Library; 2020.
- Kursa MB, Rudnicki WR. Feature selection with the Boruta package. J Stat Softw 2010; 36:1-13. [ Google Scholar]
- Robin X, Turck N, Hainard A, Tiberti N, Lisacek F, Sanchez JC. pROC: an open-source package for R and S + to analyze and compare ROC curves. BMC Bioinformatics 2011; 12:77. doi: 10.1186/1471-2105-12-77 [Crossref] [ Google Scholar]
- Cheng R, Zhang MM, Yu XM. Prediction model for road traffic accident based on random forest. DEStech Trans Soc Sci Educ Hum Sci 2019; 4:1-6. doi: 10.12783/dtssehs/icesd2019/28223 [Crossref] [ Google Scholar]
- Chen MM, Chen MC. Modeling road accident severity with comparisons of logistic regression, decision tree and random forest. Information 2020; 11(5):270. doi: 10.3390/info11050270 [Crossref] [ Google Scholar]
- Elyassami S, Hamid Y, Habuza T. Road crashes analysis and prediction using gradient boosted and random forest trees. In: 2020 6th IEEE Congress on Information Science and Technology (CiSt). IEEE; 2021. p. 520-5. doi: 10.1109/CiSt49399.2021.9357298.
- Umer M, Sadiq S, Ishaq A, Ullah S, Saher N, Madni HA. Comparison analysis of tree based and ensembled regression algorithms for traffic accident severity prediction. ArXiv [Preprint]. October 27, 2020. Available from: https://arxiv.org/abs/2010.14921.
- Quddus MA, Wang C, Ison SG. Road traffic congestion and crash severity: econometric analysis using ordered response models. J Transp Eng 2010; 136(5):424-35. doi: 10.1061/(ASCE)TE.1943-5436.0000044 [Crossref] [ Google Scholar]
- Noland RB, Quddus MA. Congestion and safety: a spatial analysis of London. Transp Res Part A Policy Pract 2005; 39(7):737-54. doi: 10.1016/j.tra.2005.02.022 [Crossref] [ Google Scholar]
- Fayaz M, Abadi A, Khodakarim S, Hoseini M, Razzaghi A. The Data-driven pattern for healthy behaviors of car drivers based on daily records of traffic count data from 2018 to 2019 near airports: a functional data analysis. JP J Biostat 2020; 17:539-57. doi: 10.17654/bs017020539 [Crossref] [ Google Scholar]