J Res Clin Med. 13:34515.
doi: 10.34172/jrcm.025.34515
Original Article
The effects of chest drainage on volume-controlled ventilation
Takahiro Hakozaki Conceptualization, Data curation, Formal analysis, Investigation, Methodology, Writing – original draft, Writing – review & editing, 
Takayuki Hasegawa Conceptualization, Data curation, Formal analysis, Investigation, Methodology, Writing – original draft, Writing – review & editing,
Satoki Inoue Conceptualization, Data curation, Formal analysis, Funding acquisition, Investigation, Methodology, Project administration, Resources, Supervision, Validation, Visualization, Writing – original draft, Writing – review & editing, , *
Author information:
Department of Anesthesiology and Division of Intensive Care, Fukushima Medical University, Fukushima, Japan
Abstract
Introduction:
Chest drainage generates negative pressure, which might affect the transpulmonary pressure (TPP). We investigated whether chest drainage affects ventilating conditions during volume-controlled ventilation (VCV) using a thoracic and lung model, and what such an effect would be.
Methods:
VCV was started with a 250 ml of tidal volume (TV). Plateau pressures (Plat-Ps) were measured using no positive end-expiratory pressure (PEEP) and no chest drainage (baseline), followed by 10 and 20 cmH2 O PEEP/no drainage, 0, 10, and 20 cmH2 O PEEP/drainage with -10 cmH2 O, or 0, 10, and 20 cmH2 O PEEP/drainage with -20 cmH2 O. In addition, Plat-TPPs were calculated based on the measured Plat-Ps. End-expiratory TPPs (EE-TPPs), defined as the TPP at the end of expiration, were also calculated.
Results:
With no chest drainage, Plat-Ps increased with an increase in PEEP and increased when 20 cmH2 O of PEEP was applied. When -10 cmH2 O chest drainage was applied, the increase in Plat-Ps with 20 cmH2 O of PEEP was even larger. In cases where -20 cmH2 O chest drainage was applied, even with applying 10 cmH2 O of PEEP, Plat-Ps increased. Plat-Ps further increased with 20 cmH2 O of PEEP. When the same EE-TPPs were generated as a result of a combination of PEEP and chest drainage, Plat-TPPs were similar during VCV with the same TV. However, they were not identical.
Conclusion:
Negative intrapleural pressure by a chest tube drainage can mimic PEEP and affect respiratory mechanics in mechanically ventilated lungs. EE-TPPs through combinations of PEEP and chest tube drainage could induce overdistension of the lungs.
Keywords: Chest drainage, Volume-controlled ventilation, Overdistension, Pressure-volume curve, Transpulmonary pressure, Positive end-expiratory pressure
Copyright and License Information
© 2025 The Author(s).
This is an open access article distributed under the terms of the Creative Commons Attribution License (
http://creativecommons.org/licenses/by/4.0/), which permits unrestricted use, distribution, and reproduction in any medium, provided the original work is properly cited.
Funding Statement
Not applicable.
Introduction
Transpulmonary pressure (TPP) is defined as the difference between alveolar and intrapleural pressures,1 and it can be calculated using the following formula: TPP = alveolar pressure - intrapleural pressure. In clinical practice, a negative pressure is typically applied to a chest tube drainage system, which creates a negative pressure in the intrapleural space. This leads to the possibility that the negative pressure generated by the chest tube system could affect TPP. Chest tube placement is a common procedure used to remove fluid, blood, or air from the pleural cavity. However, it is easy to overlook the fact that this common practice might have an impact on TPP. This is because the continuous application of intrapleural negative pressure during chest tube drainage might function similarly to positive end-expiratory pressure (PEEP). As a result, lung drainage may have a PEEP-like effect in addition to the actual PEEP applied. Figure 1 illustrates the anticipated connection between TPP and lung volume during the expiratory phase when both PEEP at 10 cmH2O and chest drainage at 10 cmH2O are applied. In this scenario, TPPs at the expiratory phase can be computed as 10 cmH2O and 20 cmH2O, respectively. Moreover, the lung volumes during the expiratory phase are expected to increase by specific amounts, for instance, x ml and x + y ml, respectively. Such situations could affect ventilation conditions. In our prior study, we explored how chest drainage influenced ventilation in the context of pressure-controlled ventilation (PCV).2 In that study, we observed that TVs remained consistent when TPP at the expiratory phase was the same, regardless of the specific TPP configuration involving PEEP and the intrapleural pressure generated by chest drainage. However, when TPP at the expiratory phase differed, the TV levels fluctuated, even with the same driving pressure in PCV. As a result, we proposed that chest tube drainage emulated the effects of PEEP, potentially influencing the starting point on the pressure-volume (P-V) curve of the lung. However, to the best of our knowledge, there have been no reports regarding this concern on volume-controlled ventilation (VCV). It is still unclear whether PCV or VCV offers an advantage in respiratory management. In fact, both ventilation modes are commonly employed, sometimes even within the same medical facility.3 Therefore, we believed it was essential to investigate the impact of chest drainage not only on PCV but also on VCV. In the present study, we investigated whether intrapleural negative pressure generated by a chest tube drainage system effects ventilation conditions during VCV, and what such an affect would be.
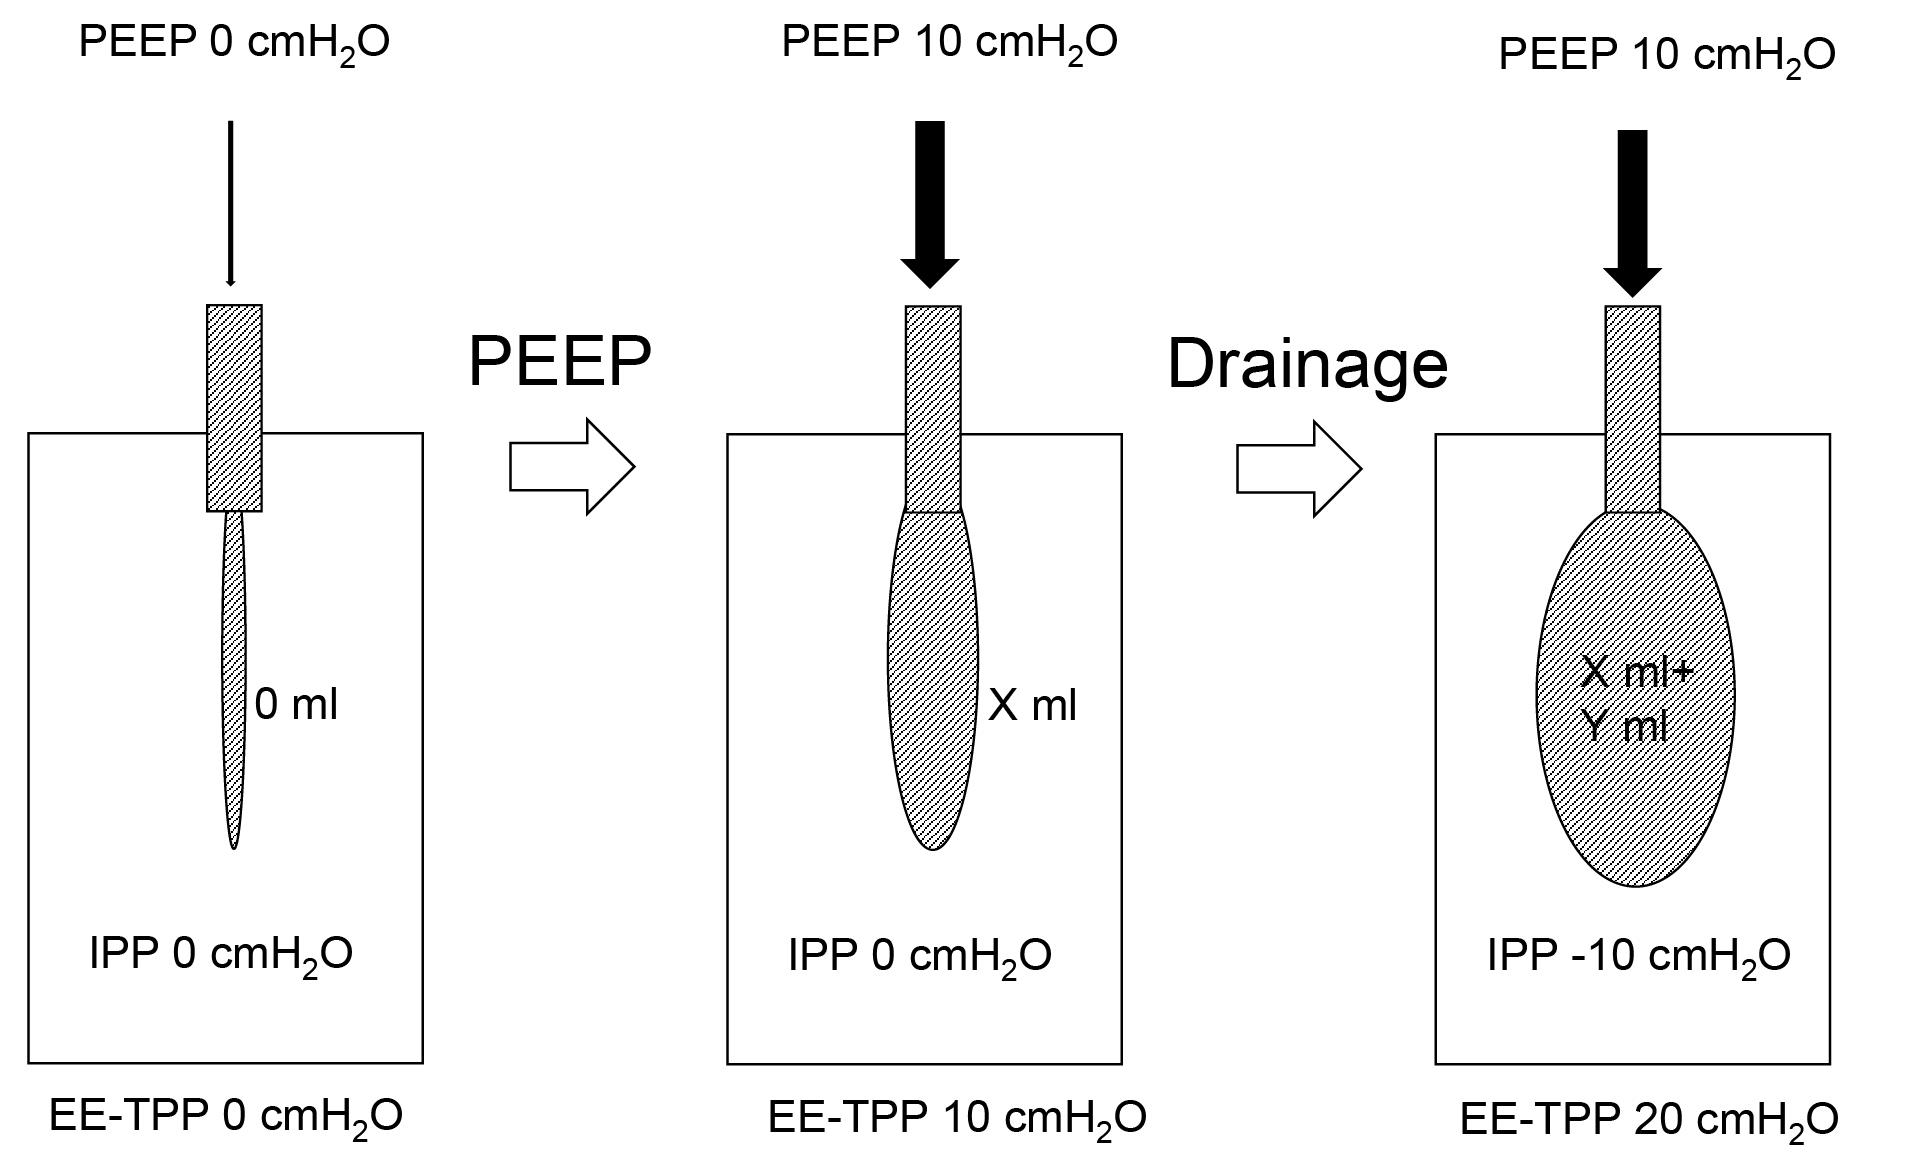
Figure 1.
Illustration for anticipated connection between TPP and lung volume during the expiratory phase. PEEP, positive end-expiratory pressure; TPP, transpulmonary pressure; EE-TPP, end-expiratory transpulmonary pressure, IPP, intrapleural pressure
.
Illustration for anticipated connection between TPP and lung volume during the expiratory phase. PEEP, positive end-expiratory pressure; TPP, transpulmonary pressure; EE-TPP, end-expiratory transpulmonary pressure, IPP, intrapleural pressure
Materials and Methods
For this study, a simple thoracic and lung model was created, identical to the one used in our previous research that investigated the impact of chest drainage on PCV.2 No ethical approval was required for this experimental setup. We employed a commercially available sealed plastic container (measuring 22 cm × 33.3 cm × 30.5 cm) typically used for food storage and preservation, which served as the thoracic cage. Additionally, a 1-liter ventilator test lung (Venti.PlusTM, GaleMed Corporation, Taiwan) with a compliance of 20 mL/cmH2O as per the manufacturer’s specifications was utilized as the experimental lung. A hole was created in the container’s cover. We affixed a standard elbow connector with inner and outer diameters of 15 mm and 22 mm, respectively, to this hole using a strong adhesive to establish an airtight system. The test lung was then placed within the thoracic cage model and connected to the elbow connector within the model. Furthermore, a disposable anesthesia breathing circuit was linked to the other end of the elbow connector situated on top of the model. Additionally, a smaller hole was made on the side of the container, and a 1.5 m flexible tube was securely attached using strong adhesive. This tube was connected to a chest tube drainage system (MERA continuous suction unit MS-009, Senko Medical Instrument Mfg. Co., Ltd. Tokyo). For the administration of ventilation, a GE Datex Ohmeda Aestiva 5 (GE Healthcare Japan, Tokyo) anesthesia ventilator was employed (refer to Figure 2 for the setup).
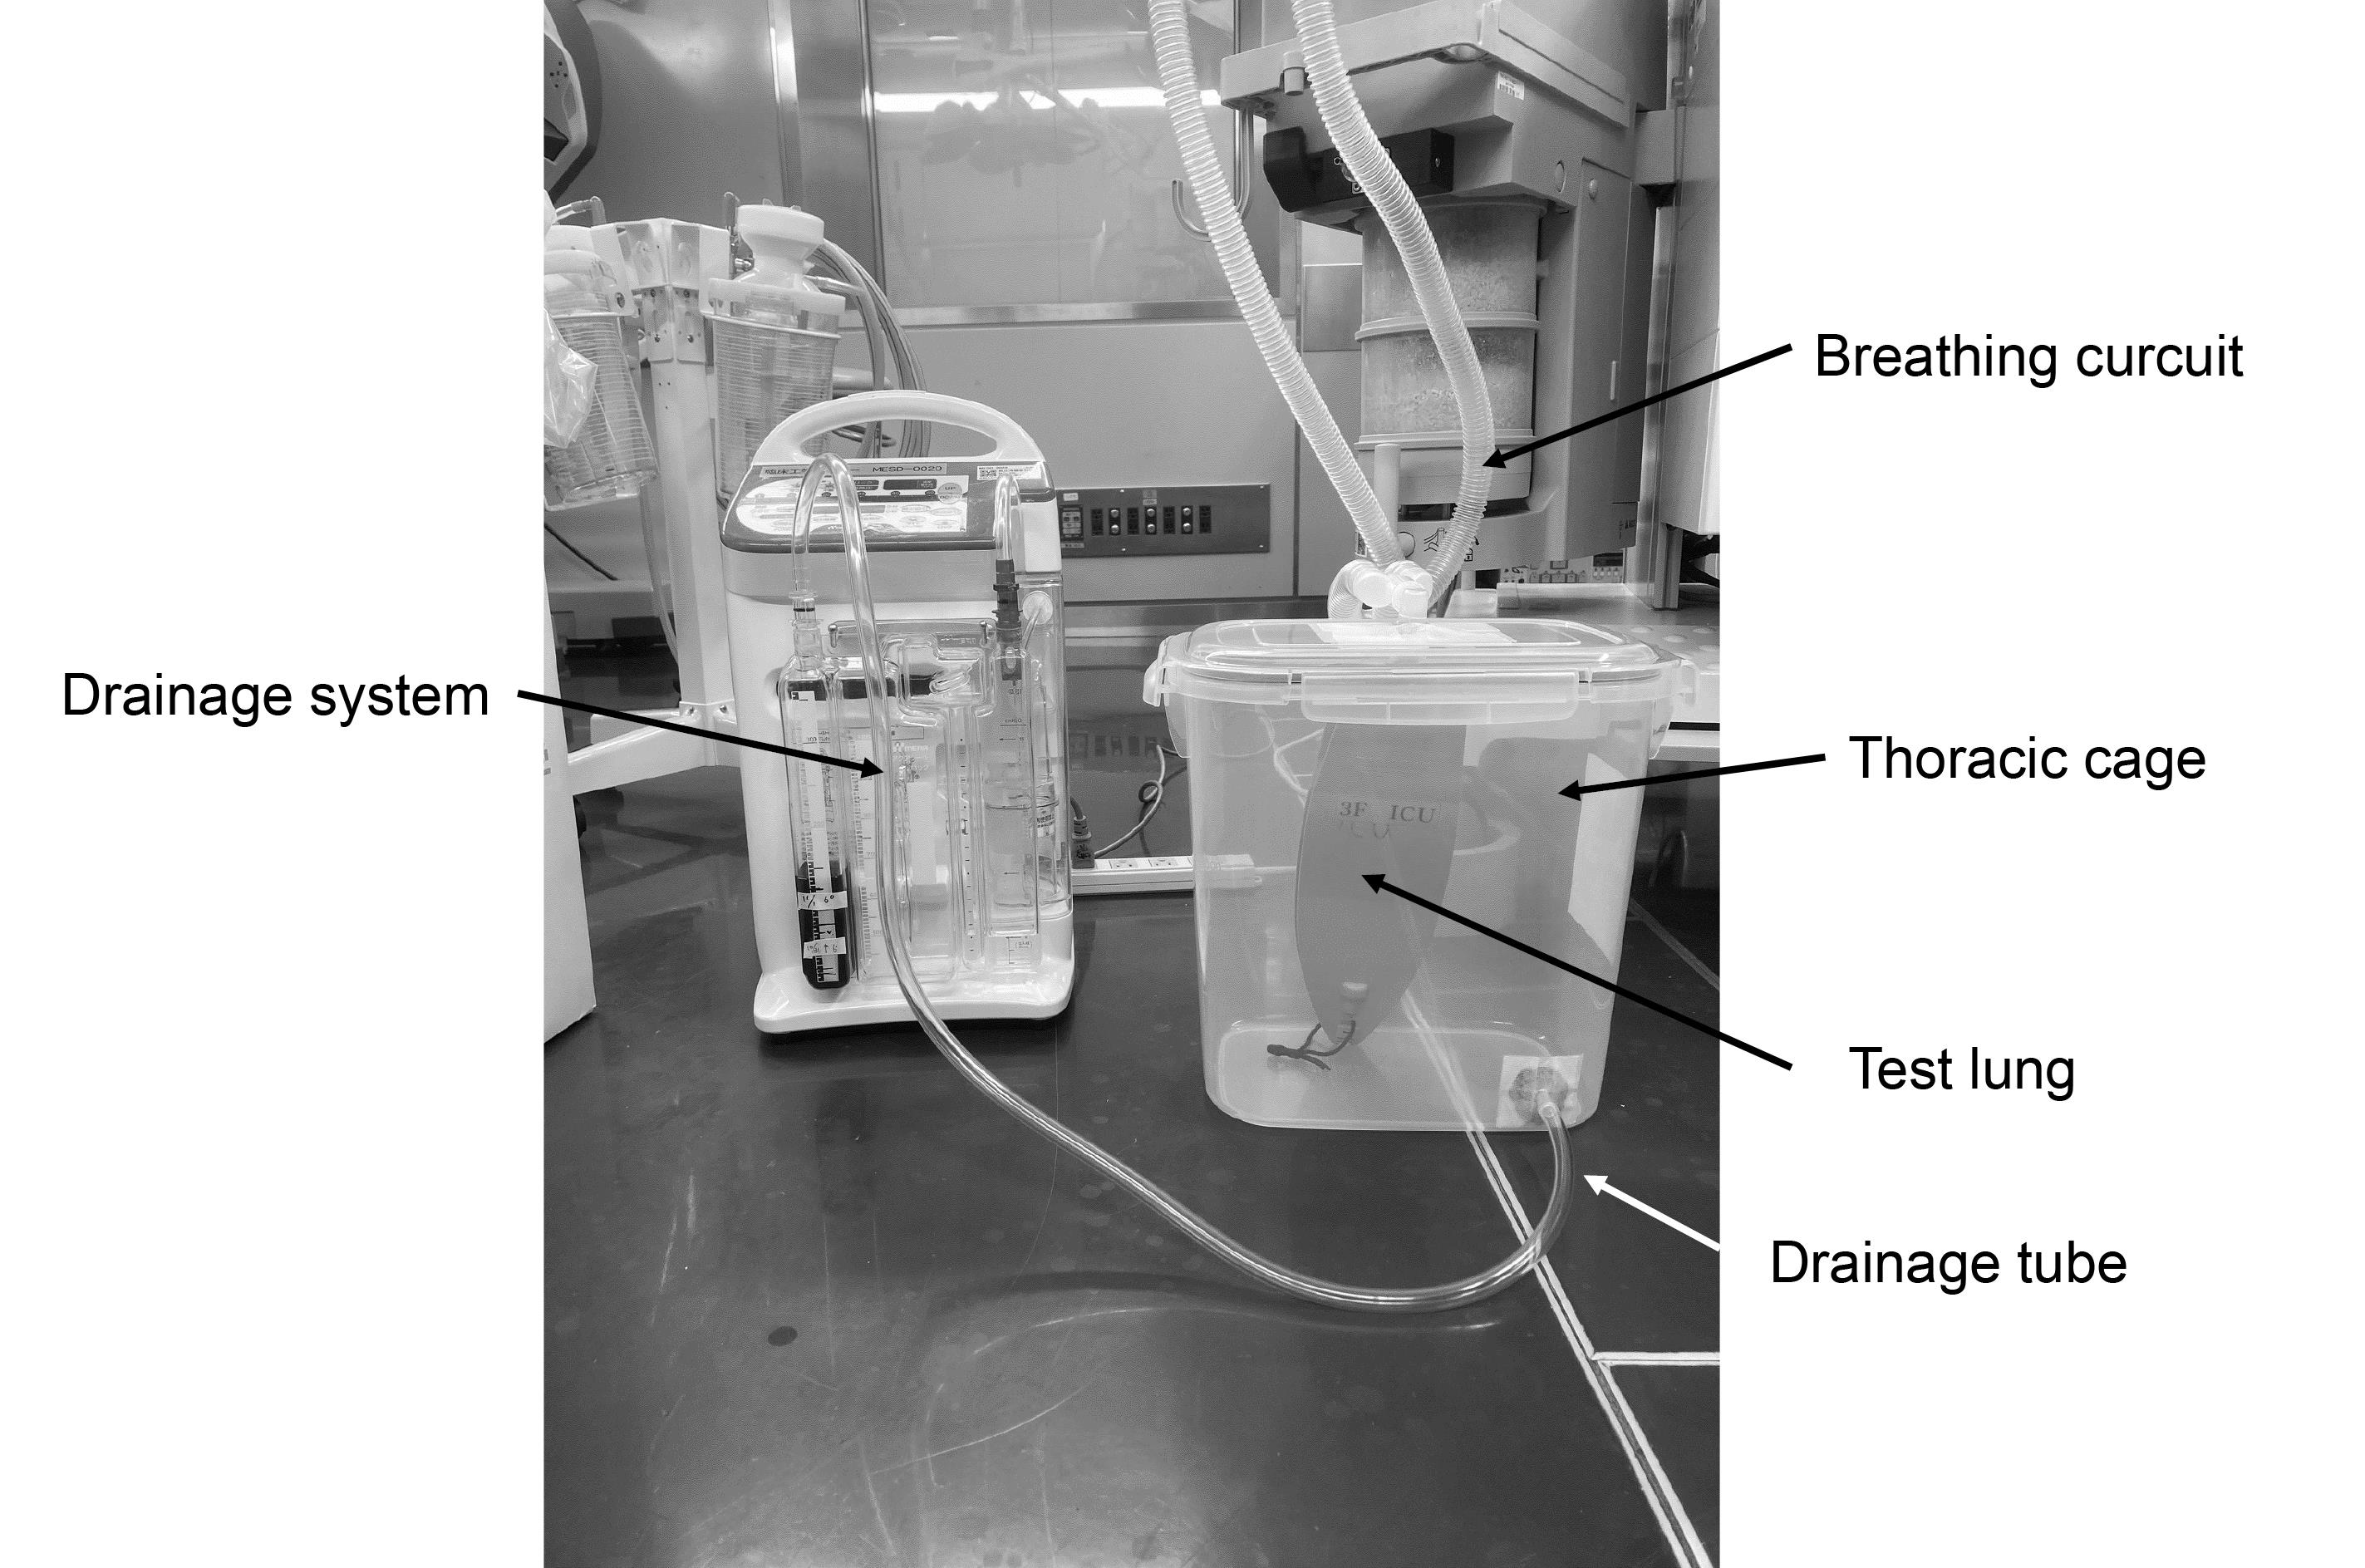
Figure 2.
Experimental thoracic and lung model and drainage system
.
Experimental thoracic and lung model and drainage system
Experimental protocol
We initiated the experimental VCV under the following settings: a TV of 250 mL, no PEEP at 0 cmH2O, and no chest drainage. We maintained a constant respiratory rate of 10 breaths per minute and an inspiratory-to-expiratory time ratio (I:E ratio) of 1:2 throughout the study, with a pause time of 50% of the inspiratory time, which we selected to ensure stable measurements of plateau pressures (Plat-Ps). We then sequentially measured Plat-Ps ten times using the built-in manometer of the Aestiva 5 ventilator and recorded their average. Subsequently, we introduced 10 cmH2O and 20 cmH2O PEEP to this ventilator setting and measured and averaged the Plat-Ps. We reset the PEEP to 0 cmH2O afterward. Additionally, we applied chest drainage at -10 cmH2O using a chest tube drainage system. Following this, we applied 0 cmH2O, 10 cmH2O, and 20 cmH2O PEEP to this ventilator setting. We measured Plat-Ps sequentially ten times, and the averages were recorded. Finally, we introduced chest drainage at -20 cmH2O, and once again applied 0 cmH2O, 10 cmH2O, and 20 cmH2O PEEP to this ventilator setting, measuring and averaging the Plat-Ps (as shown in Figure 3). We also calculated the theoretical plateau-TPP (Plat-TPP) for each setting. Moreover, we defined the end-expiratory TPP (EE-TPP) as the TPP at the end of expiration and calculated the theoretical EE-TPP for each ventilator setting. In this model, for the sake of convenience, we considered Plat-P with PEEP and drainage pressure as alveolar pressure and intrapleural pressure, respectively.
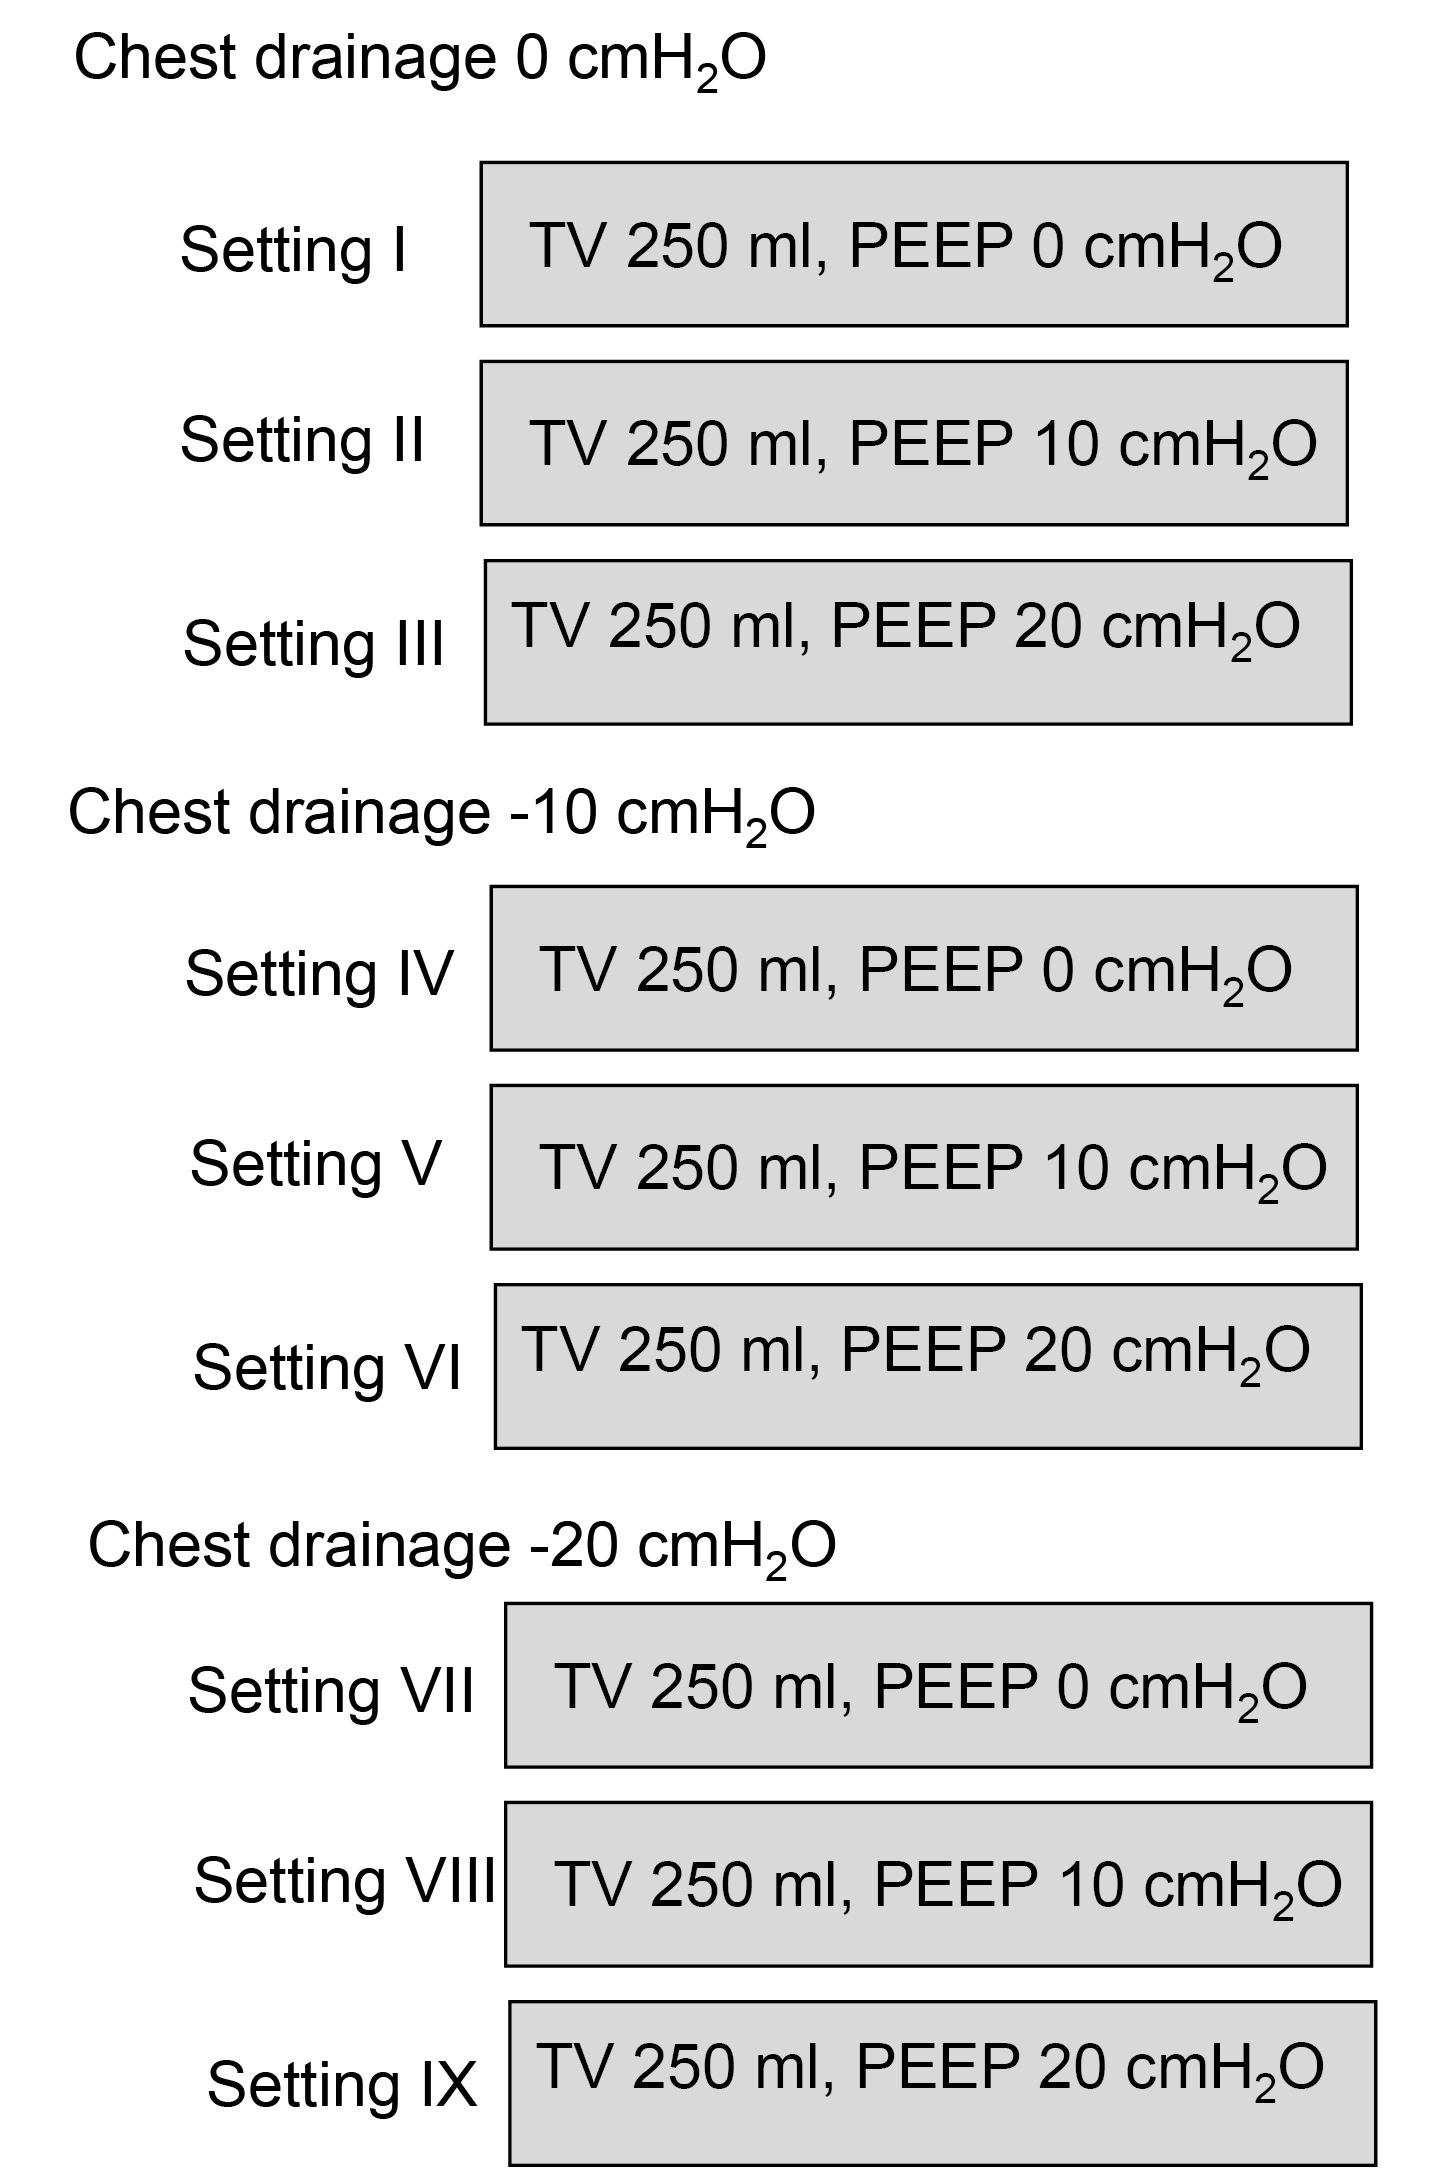
Figure 3.
Experimental protocol. TV, tidal volume; PEEP, positive end-expiratory pressure
.
Experimental protocol. TV, tidal volume; PEEP, positive end-expiratory pressure
Statistical analysis
All measured values are described as mean (standard deviation). Averaged values are displayed in figures. We did not conduct formal comparisons between the conditions because the standard deviations were so small that even trivial differences could be detected. We did not perform sample size calculations as this study was primarily exploratory and observational in nature.
Results
In cases where there was no chest drainage, we observed that the measured Plat-Ps increased as the level of PEEP increased. Notably, when we applied 20 cmH2O of PEEP, the Plat-Ps increased significantly. However, when we introduced -10 cmH2O of chest drainage, the increase in Plat-Ps with 20 cmH2O of PEEP was even more pronounced. In cases of -20 cmH2O chest drainage, Plat-Ps increased substantially even with just 10 cmH2O of PEEP, and it further increased with 20 cmH2O of PEEP (Figure 4).
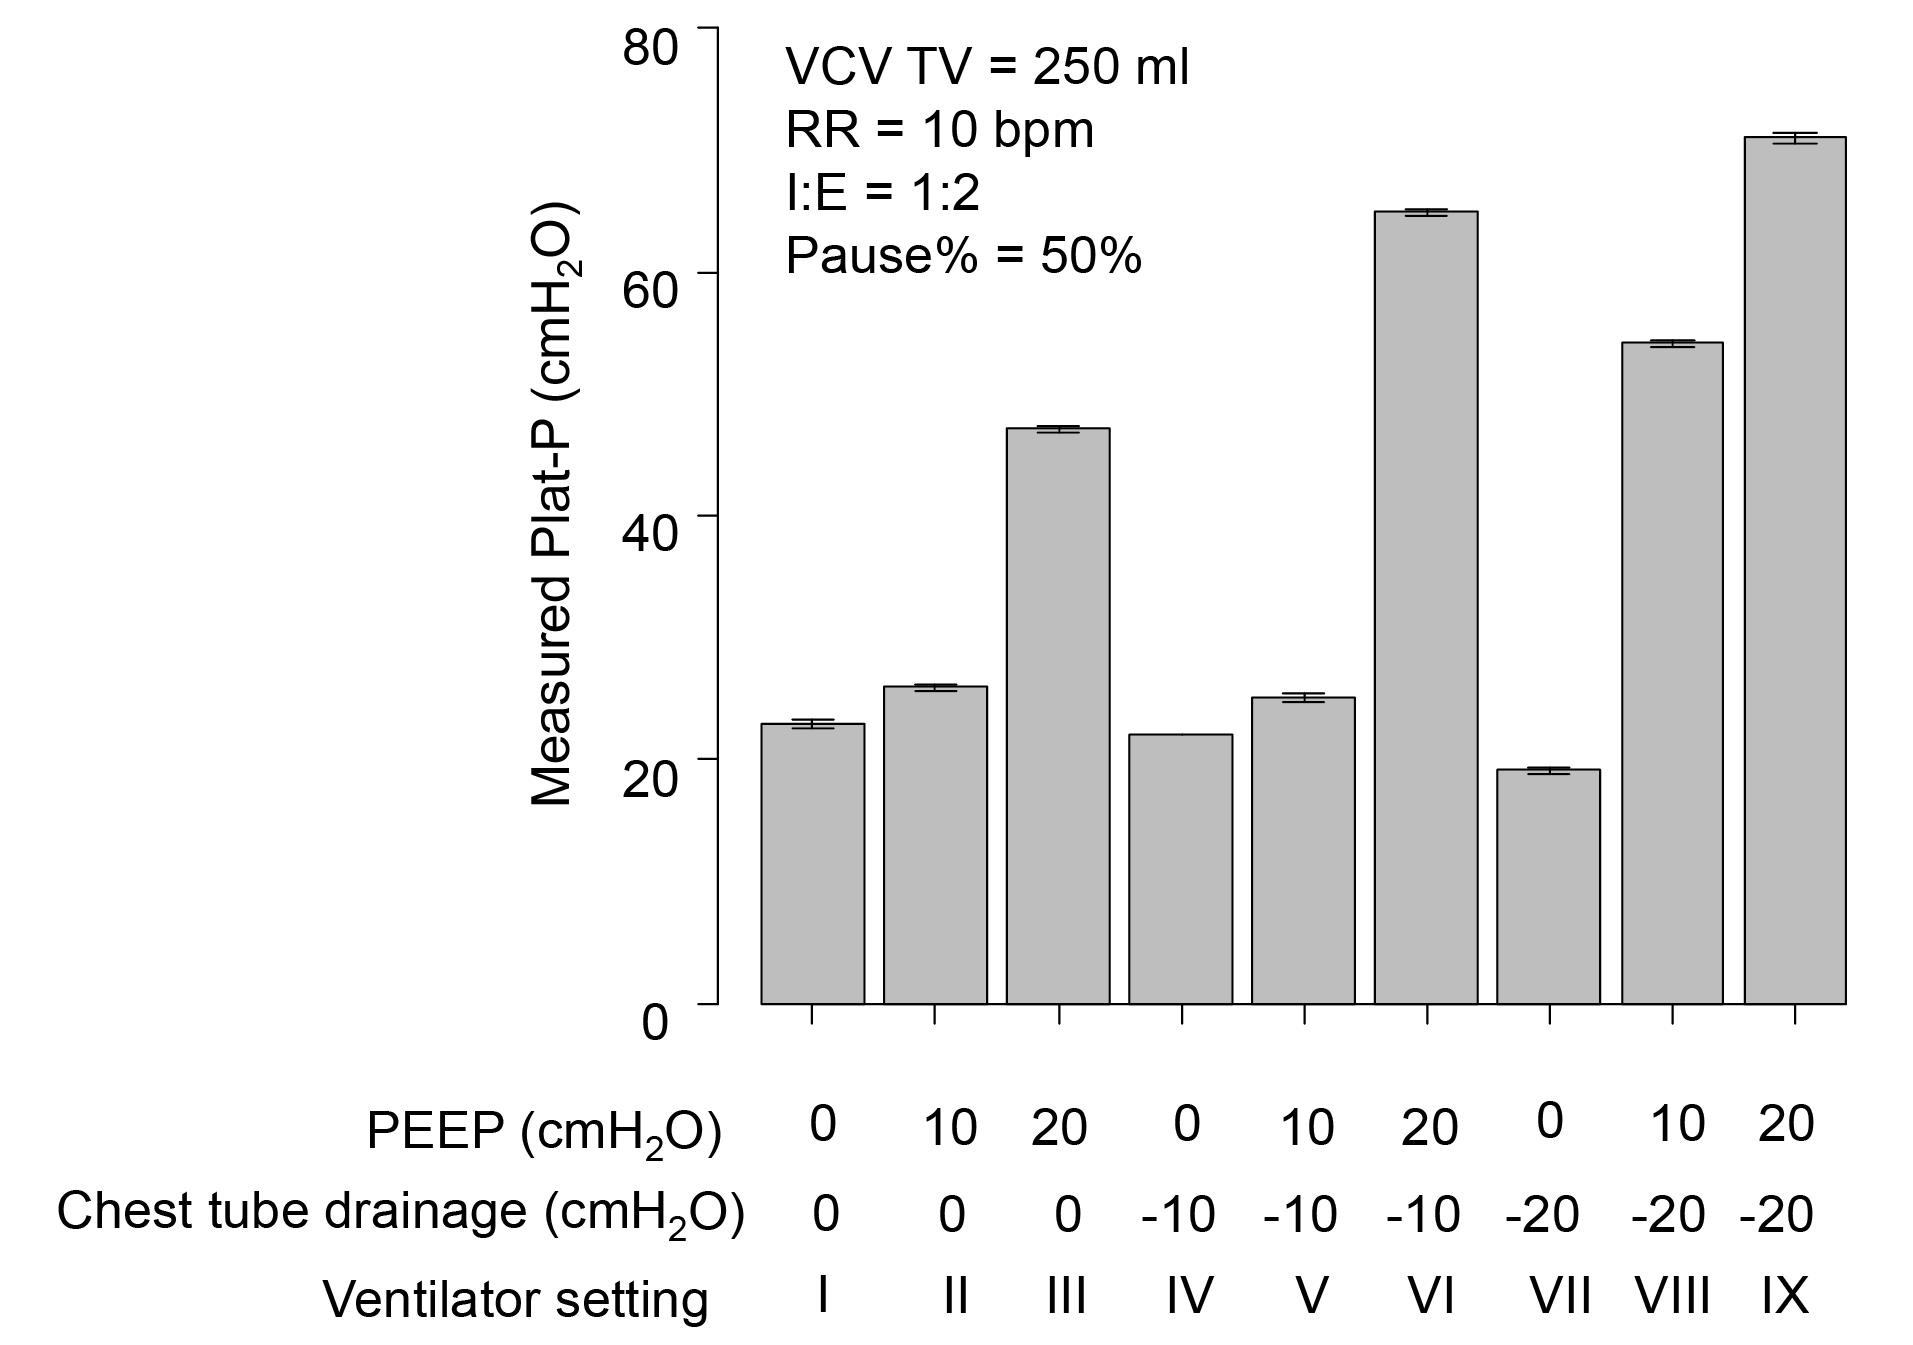
Figure 4.
Measured plateau pressure. VCV, volume-controlled ventilation; TV, tidal volume; RR, respiratory rate; I:E, inspiratory-to-expiratory time; PEEP, positive end-expiratory pressure; Plat-P, plateau pressure
.
Measured plateau pressure. VCV, volume-controlled ventilation; TV, tidal volume; RR, respiratory rate; I:E, inspiratory-to-expiratory time; PEEP, positive end-expiratory pressure; Plat-P, plateau pressure
Looking at the bar graphs for theoretical Plat-TPPs in Figure 5, we observed a similar trend as with the measured Plat-Ps. When -0 and -10 cmH2O of chest drainage were applied, theoretical Plat-TPPs increased almost linearly with rising PEEP until they reached 40 cmH2O. Beyond 40 cmH2O, there was a sudden and substantial increase. Additionally, when we generated the same theoretical EE-TPPs, i.e., settings II and IV with 10 cmH2O of EE-TPP, settings III, V, and VII with 20 cmH2O of EE-TPP, and settings VI and VIII with 30 cmH2O of EE-TPP, we found that the theoretical Plat-TPPs were similar but not identical.
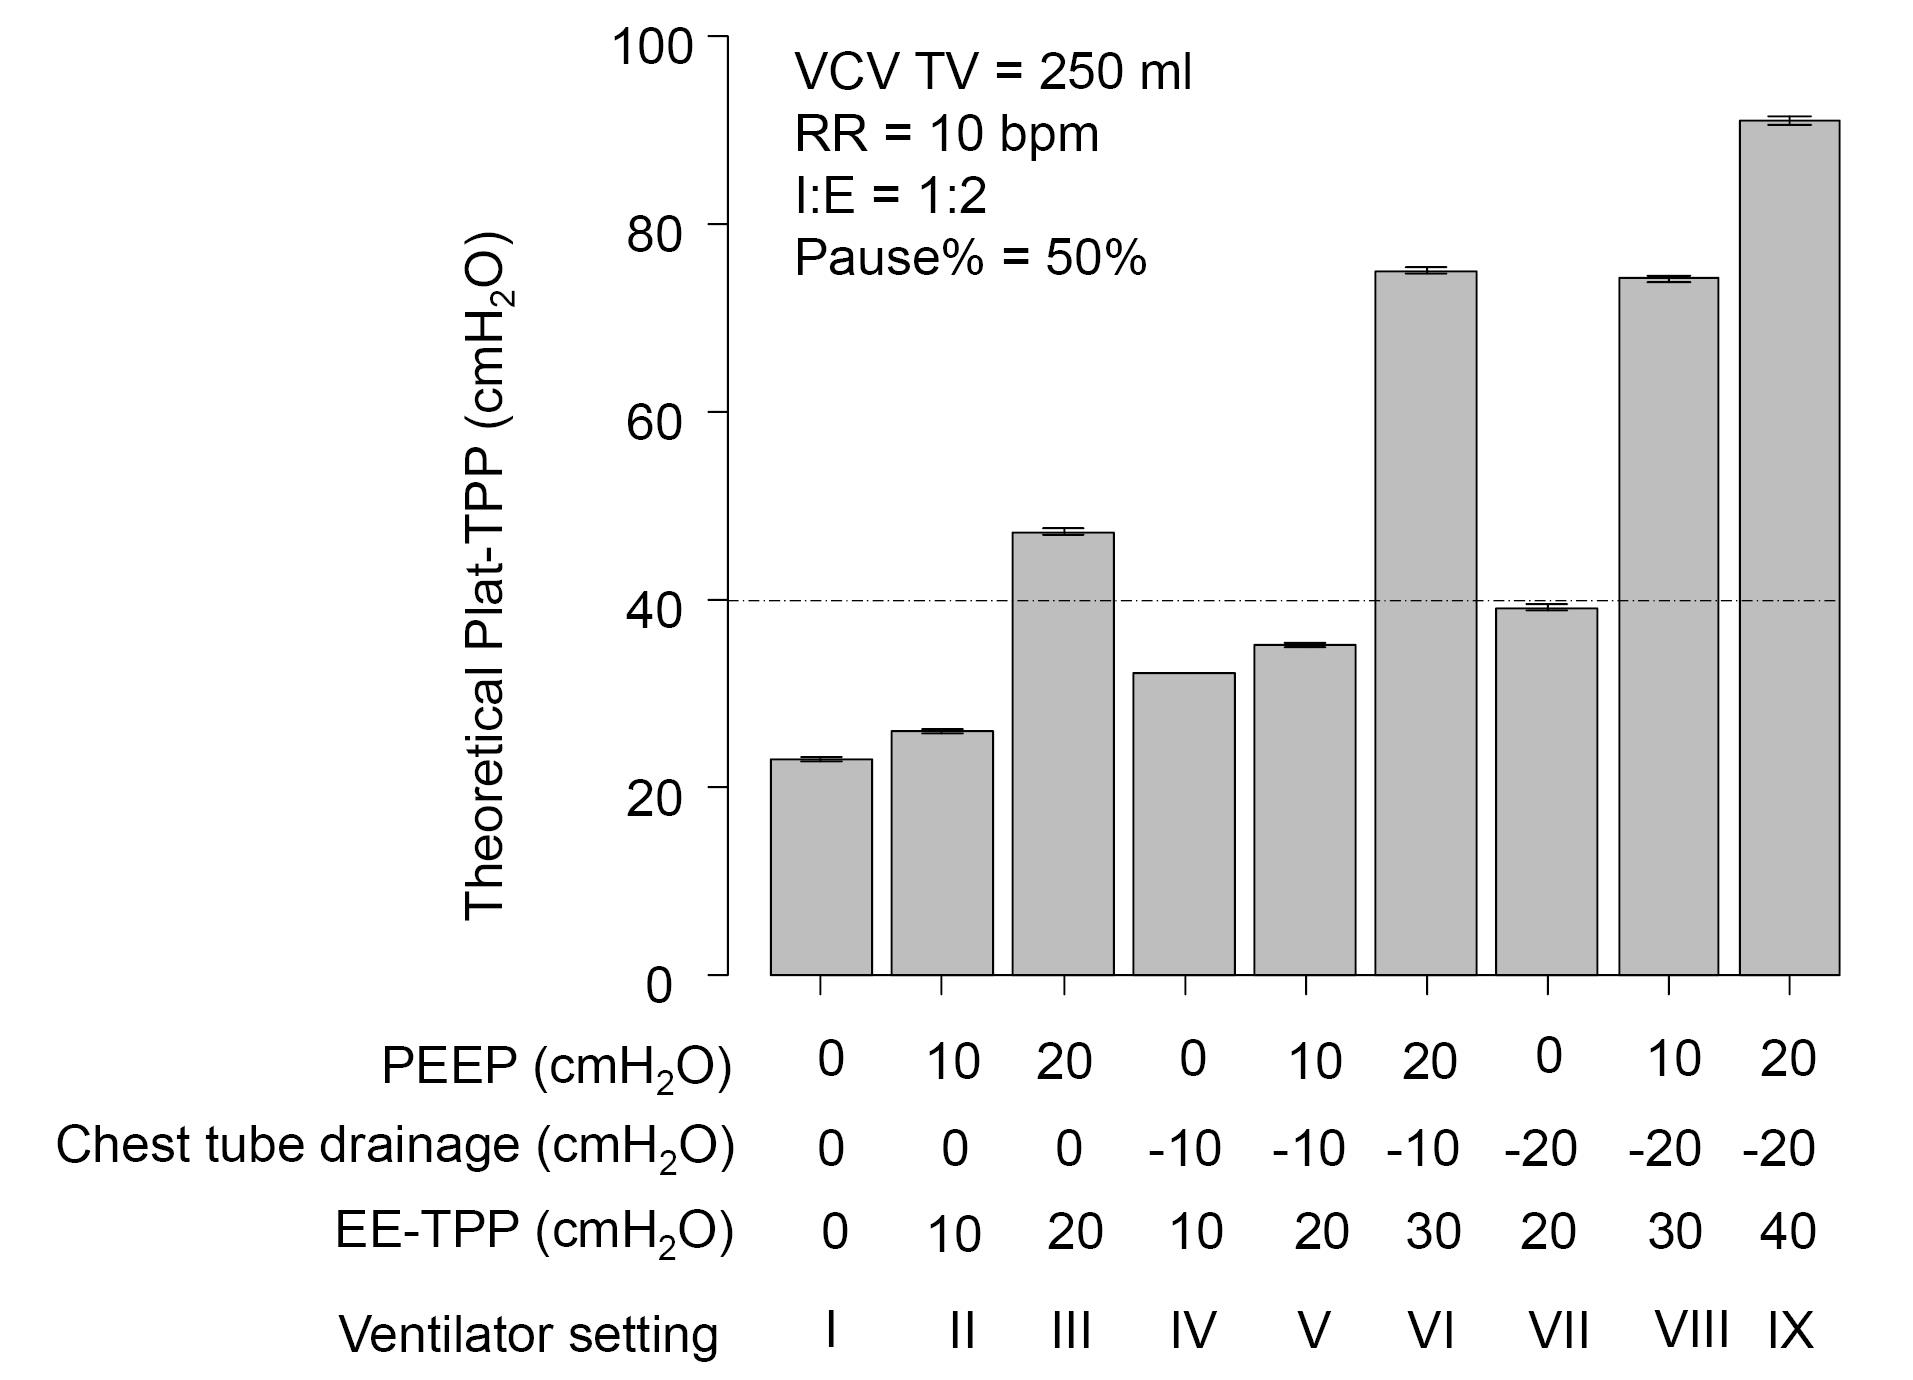
Figure 5.
Theoretical plateau transpulmonary pressure. VCV, volume-controlled ventilation; TV, tidal volume; RR, respiratory rate; I:E, inspiratory-to-expiratory time; PEEP, positive end-expiratory pressure; Plat-TPP, plateau transpulmonary pressure; EE-TPP, end-expiratory transpulmonary pressure
.
Theoretical plateau transpulmonary pressure. VCV, volume-controlled ventilation; TV, tidal volume; RR, respiratory rate; I:E, inspiratory-to-expiratory time; PEEP, positive end-expiratory pressure; Plat-TPP, plateau transpulmonary pressure; EE-TPP, end-expiratory transpulmonary pressure
Discussion
This experimental study, using the same TVs in VCV, has revealed that measured Plat-Ps increased with higher levels of PEEP. Notably, Plat-Ps showed a sudden and substantial increase when higher PEEP settings were applied. This effect was further magnified when chest tube drainage was introduced and can be attributed to the characteristics of the P-V curve of the test lung utilized in this study. It’s worth noting that in the original concept of the P-V curve, “pressure” refers to “alveolar pressure,” but it’s more appropriate to consider the actual type of pressure.4 The reason behind the sharp increase in Plat-Ps with high PEEP levels, even with the same TV applied, may be due to the test lung reaching its upper inflection point. This point signifies that the lung’s capacity to expand becomes increasingly difficult when exposed to higher pressures (as illustrated in Figure 6). Figure 6 illustrates a hypothetical P-V curve for the test lung, visualizing this concept.
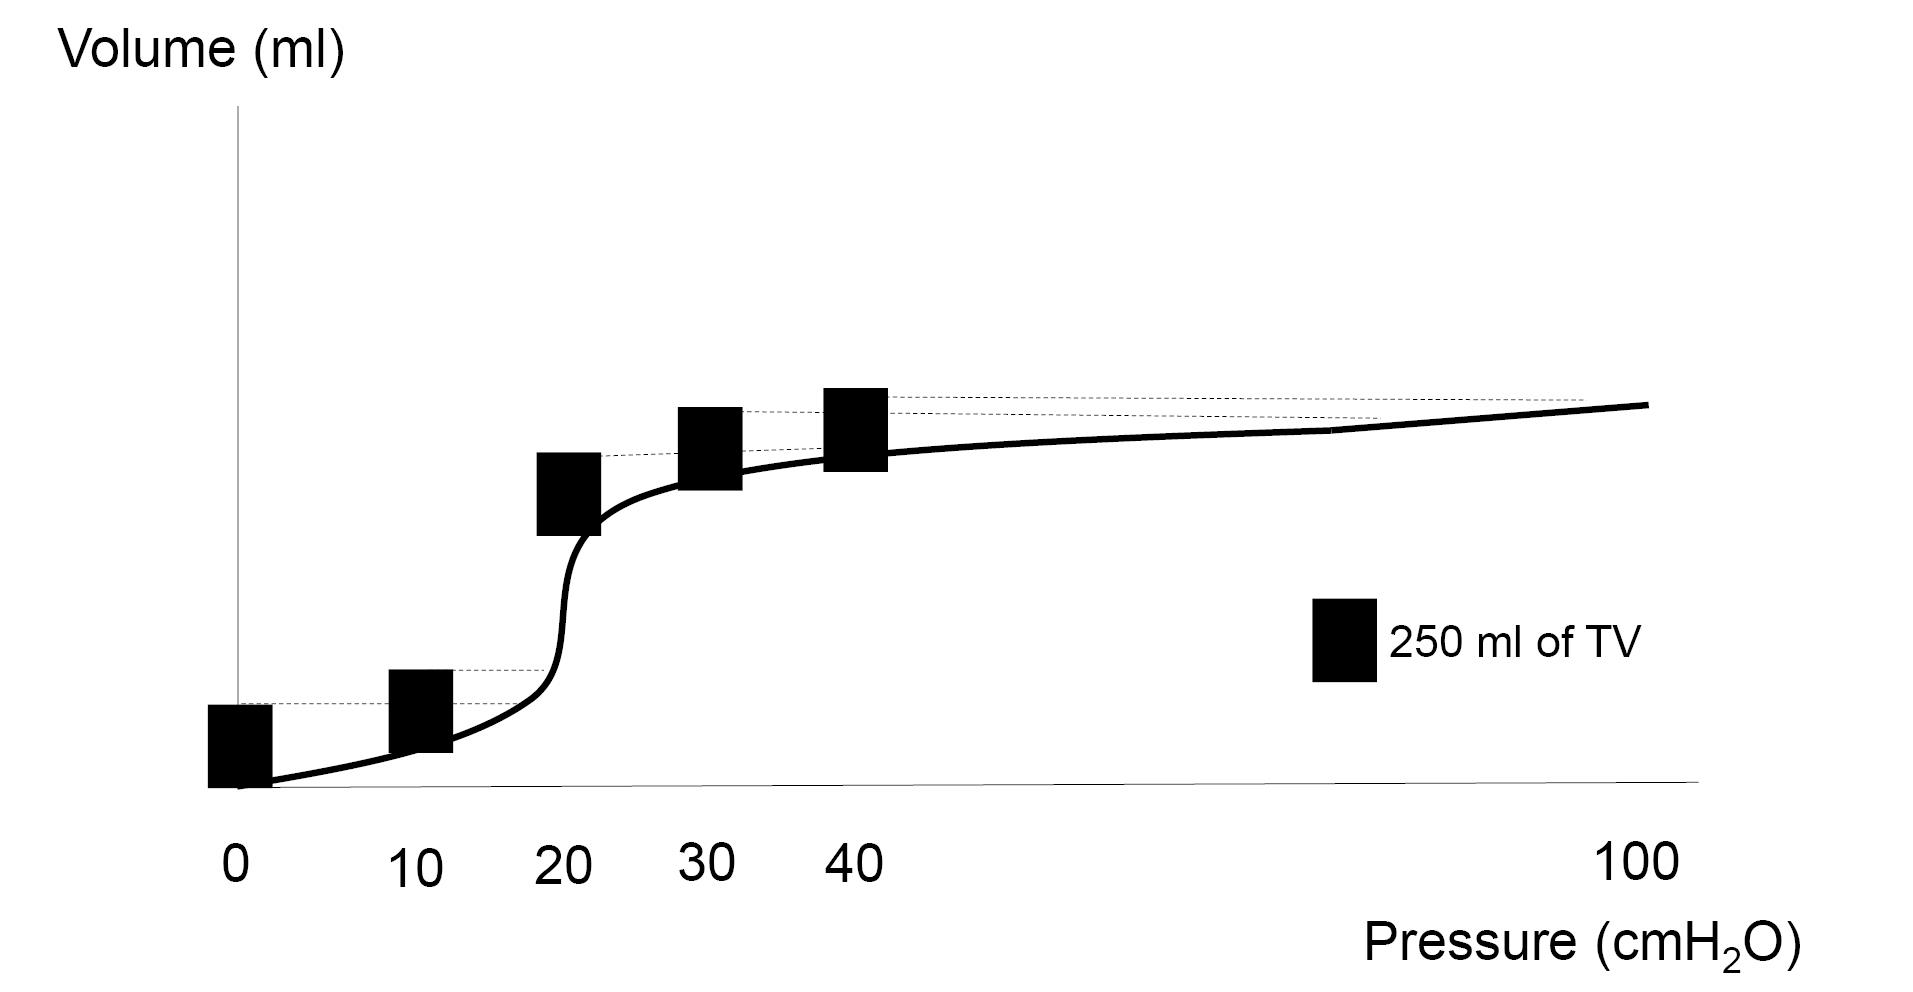
Figure 6.
Assumed mock P-V curve for the test lung used in this study. TV, tidal
.
Assumed mock P-V curve for the test lung used in this study. TV, tidal
When there’s no chest drainage, it is easy to understand that PEEP can shift the starting point to the right on the pressure-volume (P-V) curve. Applying a specific TV further moves the point along the P-V curve, and this progression generates Plat-Ps according to the P-V curve. Consequently, in the case of using 20 cmH2O PEEP and applying 250 mL TVs, the test lung experiences overdistension, as seen in Figure 6. However, when chest drainage is introduced, we need to consider the concept of TPP. As mentioned previously, TPP is defined as the difference between alveolar and intrapleural pressures.5 We assumed that the continuous negative pressure generated by the chest tube drainage system could impact TPP and function in a manner similar to PEEP. Hence, theoretical EE-TPPs, which are thought to work like PEEP, could also shift the starting point to the right on the P-V curve. When we applied 30 cmH2O and/or 40 cmH2O of theoretical EE-TPP, we observed a sudden increase in measured Plat-Ps, as well as theoretical Plat-Ps. Moreover, when we applied 30 cmH2O of theoretical EE-TPP, the theoretical Plat-Ps remained similar, regardless of PEEP or chest drainage values, when the same TVs were used. These observations suggest that the increase in theoretical EE-TPP due to chest tube drainage can also move the starting point to the right on the P-V curve, leading to further overdistension of the test lung, even when the same TVs are applied.
When we applied 20 cmH2O of theoretical EE-TPP, the Plat-Ps were not exactly the same but also not significantly different across various settings when the same TVs were used. Based on our observations, it appears that the test lung had an upper inflection point on its own P-V curve, which fell in the range of 30–40 cmH2O of pressure. It’s well-known that lung compliance undergoes significant changes when pressure passes near an upper inflection point, which may explain why Plat-Ps fluctuated even with the same EE-TPP applied in our study. Alternatively, it’s possible that the effects of positive and negative pressure on TPP may vary, especially at lower pressure levels along the P-V curve.
In a clinical context, it is essential to recognize that continuous negative intrapleural pressure from chest drainage leads to a constant positive TPP. This continuous positive TPP can shift the starting point on the P-V curve, depending on the magnitude of continuous negative intrapleural pressure. This aspect might be overlooked, particularly in cases with restricted P-V curves similar to the test lung used in our study. In such scenarios, overdistension of the lung can easily occur even with lower TVs. Consequently, when chest drainage is initiated in this context, we may observe a significant and sudden increase in Plat-Ps during VCV. Indeed, we experienced a case of a significant reduction of TVs during PCV immediately after chest tube drainage following lower lobectomy.6 Consequently, switching PCV to VCV secured appropriate TVs; however, the Plat-Ps significantly increased compared to the Plat-Ps without chest drainage. In that case, we speculated that negative intrapleural pressure increased the residual volume, which might move the starting point to the right on the P-V curve of the limited lung volume after lobectomy, resulting in passing the vicinity of an upper inflection point. We also suggested that there may be a risk of overdistension of the lung in such a case.
In our study, both measured and theoretical Plat-Ps displayed fluctuations with the application of PEEP or chest drainage. Furthermore, our findings indicated that when any level of PEEP or chest drainage was applied, theoretical Plat-Ps only exhibited minimal changes when TVs and EE-TPP remained constant during VCV. Hence, it’s crucial to know that in cases requiring chest drainage, Plat-TPPs could surpass expectations, even when measured Plat-Ps fall within an acceptable range. Moreover, both measured and theoretical Plat-Ps can experience a sudden and substantial increase, even when using the same TV, if the EE-TPP is excessively high. In short, an event may occur where even casual chest drainage can lead to significantly higher EE-TPPs than what was initially considered as just PEEP. This situation might cause the pressure generated by applied TVs to surpass the upper inflection point of the P-V curve, particularly in cases of restricted lung function. Lastly, as mentioned before, it’s obviously known that negative pressure induced with chest drainage is effective for improving pulmonary function in specific situations because this negative pressure drains fluid, blood, or air from the pleural cavity. However, it’s important to be aware that the previously mentioned concern can arise as a result of chest drainage even in a casual manner.
This was an experimental study using a hand-made thoracic and lung model. Therefore, it is not certain whether the continuous negative pressure generated by the chest tube drainage system could work in humans like it did in this experimental model. Furthermore, the plastic container used as a thoracic cage in this study was quite rigid. As a result, the test lung may have experienced some limitations in inflating within this firm, airtight sealed enclosure compared to conditions outside the container. While this concern may have had an impact on the study results, it’s important to note that the significant findings in this study remain unchanged. In addition, the pressure range for the TVs tested in this experiment is much larger than that used in the real clinical world. The reason why we used this pressure range is because the use of extreme settings may result in a better understanding of drastic changes of airway pressure. Therefore, we believe that our findings are noteworthy. Finally, it’s worth noting that in this study, a TV of 250ml was used, which is typically suitable for large pediatric patients or small adults but may not be optimal for the majority of adult patients. We selected this TV setting due to the limitations of our experimental setup as previously described. However, we believe that we would have obtained the exact same results if we had used a larger model.
Study Highlights
-
Chest tube affects respiratory mechanics in mechanically ventilated lungs.
-
Chest drainage generates negative pressure, which might affect the TPP.
-
Continuous negative intrapleural pressure generated by a chest tube drainage system might mimic PEEP.
-
Chest tube drainage could move the starting point to the right on the pressure-volume curve and induce overdistension of the lungs during VCV.
Conclusion
Chest drainage is a familiar and commonly utilized procedure in clinical practice. Therefore, it’s vital to recognize that the ongoing negative intrapleural pressure created by a chest tube drainage system can mimic PEEP and influence respiratory mechanics during VCV.
Competing Interests
There is no conflict of interest.
Ethical Approval
Not applicable.
Acknowledgements
The authors acknowledge Scientific English Editing Section of Fukushima Medical University for their proofreading.
References
- Akoumianaki E, Maggiore SM, Valenza F, Bellani G, Jubran A, Loring SH. The application of esophageal pressure measurement in patients with respiratory failure. Am J Respir Crit Care Med 2014; 189(5):520-31. doi: 10.1164/rccm.201312-2193CI [Crossref] [ Google Scholar]
- Matsumoto Y, Obara S, Hakozaki T, Isosu T, Inoue S. The effects of chest drainage on pressure-controlled ventilation. JA Clin Rep 2022; 8(1):78. doi: 10.1186/s40981-022-00568-7 [Crossref] [ Google Scholar]
- Chacko B, Peter JV, Tharyan P, John G, Jeyaseelan L. Pressure-controlled versus volume-controlled ventilation for acute respiratory failure due to acute lung injury (ALI) or acute respiratory distress syndrome (ARDS). Cochrane Database Syst Rev 2015; 1(1):CD008807. doi: 10.1002/14651858.CD008807.pub2 [Crossref] [ Google Scholar]
- Hess DR. Respiratory mechanics in mechanically ventilated patients. Respir Care 2014; 59(11):1773-94. doi: 10.4187/respcare.03410 [Crossref] [ Google Scholar]
- Vargas M, Sutherasan Y, Gregoretti C, Pelosi P. PEEP role in ICU and operating room: from pathophysiology to clinical practice. ScientificWorldJournal 2014; 2014:852356. doi: 10.1155/2014/852356 [Crossref] [ Google Scholar]
- Shiraishi T, Obara S, Hakozaki T, Isosu T, Inoue S. A case requiring re-thoracotomy due to a significant reduction of tidal volume after commencement of chest tube drainage under pressure control ventilation following lower lobectomy. JA Clin Rep 2022; 8(1):36. doi: 10.1186/s40981-022-00526-3 [Crossref] [ Google Scholar]