J Res Clin Med. 12:31.
doi: 10.34172/jrcm.34483
Original Article
Effects of thyroid status on HbA1c
Sivaranjani Ambalavanan Data curation, Formal analysis, Investigation, Software, Supervision, Validation, Visualization, Writing – original draft, Writing – review & editing, 1 
Sathya Selvarajan Conceptualization, Formal analysis, Investigation, Methodology, Supervision, Validation, Visualization, Writing – original draft, Writing – review & editing, 2
K. Sowmya Conceptualization, Formal analysis, Investigation, Project administration, Resources, Supervision, Validation, Visualization, Writing – original draft, Writing – review & editing, 1, *
Author information:
1Department of Biochemistry, Sri Ramachandra Institute of Higher Education and Research, Porur, Chennai – 600116, India
2Department of Laboratory Medicine, Sri Ramachandra Institute of Higher Education and Research, Porur, Chennai – 600116,, India
Abstract
Introduction:
Altered erythrocyte turnover may not adequately reflect the glycemic status in the glycated hemoglobin (HbA1c) levels. Hypothyroidism is one such condition that might cause reduced erythropoiesis and falsely high HbA1c values. The aim of the study is to evaluate the effect of thyroid hormone on HbA1c levels on non-diabetic hypothyroid individuals and also to evaluate HbA1c levels in hypothyroid individuals with diabetes and to compare them with normal healthy subjects.
Methods:
This prospective study was conducted on 210 individuals, of whom 70 were assigned to group I- hypothyroid individuals, 70 to group II- hypothyroid individuals with diabetes, and 70 to group III—Normal individuals. Following data regarding laboratory investigations were collected which included fasting blood sugar (FBS), postprandial blood sugar (PPBS), HbA1c, free triiodothyronine (fT3), free thyroxine (fT4), and thyroid stimulating hormone (TSH). Data analysis was performed using SPSS version 16.0.
Results:
The median level of HbA1c was significantly higher in hypothyroid than in normal individuals (5.6 [5.5-5.7] % vs 5.2 [5-5.3] %, P≤0.001). The median level of TSH was significantly higher in hypothyroid than in normal individuals (11.13 [6.9-22.9] μIU/mL vs 2.15 (1.33-1.60) μIU/mL). The serum level of HbA1c was significantly positively correlated with TSH in hypothyroid individuals (r=0.281, P≤0.01).
Conclusion:
There is a positive correlation between HbA1c and TSH, and a negative correlation between HbA1c and fT4 levels. Serum HbA1c levels were significantly higher in hypothyroid individuals than the normal individuals. Therefore, our study suggests that we should proceed with caution while interpreting HbA1c levels in individuals with hypothyroidism.
Keywords: Diabetes mellitus, Glycated hemoglobin, Hypothyroidism
Copyright and License Information
© 2024 The Authors.
This is an open access article distributed under the terms of the Creative Commons Attribution License (
http://creativecommons.org/licenses/by/4.0/), which permits unrestricted use, distribution, and reproduction in any medium, provided the original work is properly cited.
Funding Statement
Not applicable.
Introduction
“The fraction of hemoglobin that undergoes non-enzymatic glycation during the circulatory lifespan of erythrocytes is referred to as glycated hemoglobin (HbA1c)”. It depends on the blood glucose level for the past 2-3 months and the average period of exposure of the circulatory erythrocytes to this glucose level. The use of HbA1c as one of the most crucial markers in the screening and diagnosis of diabetes mellitus (DM) has been established by the American Diabetes Association recommendations.1 A level of HbA1c between 5.7% and 6.4% is considered as prediabetic, and a value > 6.5% is considered as diabetic.2 HbA1c levels are influenced by various factors related to the red blood cell (RBC) life cycle, such as erythrocyte turnover/survival. Pathological conditions like hemoglobinopathies, hemolytic anemia, acute and chronic blood loss, thyroid disorders, uremia, and pregnancy can cause falsely high/low HbA1c levels. Thyroid hormones play an important role in erythropoiesis. Lowered levels of thyroid hormone in hypothyroidism lead to decreased erythrocyte synthesis, which may shorten erythrocyte lifespan. It is anticipated that this decreased erythropoiesis will result in HbA1c values to deceptively increase, which subsequently leads to misdiagnosis of pre-diabetes or diabetes. Therefore, we aimed to evaluate the effect of thyroid hormone on HbA1c levels on non-diabetic hypothyroid individuals and also to evaluate HbA1c levels in diabetic hypothyroid individuals and to compare it with normal healthy subjects.
Methods
This prospective case-control study was conducted at the Department of Biochemistry, Sri Ramachandra Medical College and Research Institute, Chennai. The study population included individuals who underwent a Master Health Check-up at Sri Ramachandra Medical Centre in the year 2021 and subjects who had undergone HbA1c and thyroid function tests were included in the study. Participants between 18 and 60 years of age who were diagnosed with euglycemic hypothyroidism and diabetes with overt hypothyroidism were recruited as cases. Age- and gender-matched healthy euthyroid and euglycemic individuals were recruited as controls. Subjects with hemoglobin (Hb) < 10 g/dL, hemoglobinopathies, renal or liver diseases, recent blood transfusions, and pregnant women were excluded from the study.
Sample size calculation was done using CaTS power calculator software, California, USA.
The sample size was estimated at a significance level of 5% and a power of 80%. The sample size was estimated to be a minimum of 70 for each group.
The study participants were categorized into 3 groups
-
Group I: Hypothyroid individuals
-
Group II: Hypothyroid individuals with diabetes
-
Group III: Age & gender-matched healthy euthyroid and euglycemic persons (controls).
The study was approved by the Institutional Ethics Committee of Sri Ramachandra Institute of Higher Education and Research and conducted in accordance with its recommendations. Confidentiality of participants’ data will be maintained. Data was prospectively collected from the case sheets of patients who attended Master Health Check-up,. The charts of the individuals undergoing Master Health Check-up were reviewed for history along with relevant laboratory investigations. The following data from the medical records for each participant were recorded: age, gender, body mass index, past history, drug history, and diagnosis if any. Laboratory investigations related to the study, including fasting blood sugar (FBS), postprandial blood sugar (PPBS), HbA1c, free triiodothyronine (fT3), free thyroxine (fT4), and thyroid stimulating hormone (TSH) were also documented.
All statistical analyses were performed using the Statistical Package for the Social Science Statistical (SPSS) software for Windows, version 16.0. All the data needed for the study were obtained and statistically evaluated to determine the significance of various parameters. A P value of < 0.05 was considered statistically significant. Analyses of cross-tabulations were performed on categorical variables. The Shapiro-Wilk test was used to determine whether the variable distribution was normal. Age had a normal distribution and is therefore expressed as mean ± standard deviation. Body mass index (BMI), Hb, HbA1c, FBS, PPBS, fT3, fT4, and TSH had non-normal in distributions and are expressed as median & interquartile range. The Kruskal-Wallis test was used to evaluate the statistical significance among the groups. The Spearman rank correlation coefficient was used to evaluate the relationship between the variables.
Results
A total of 210 participants were included in this study, of whom 70 were in
group I- hypothyroid, 70 in group II- hypothyroid individuals with diabetes, and 70 in group III- normal individuals (Age and gender-matched healthy euthyroid and euglycemic persons were recruited). The majority of those in number 53.80 % were men.
Age had a normal distribution in this study and hence was expressed as mean + standard deviation. BMI had a non-normal distribution and was expressed as median and interquartile range (Table 1).
Table 1.
Baseline characteristics of group I (hypothyroid individuals), group II (hypothyroid individuals with diabetes), and group III (control)
|
Variables
|
Group I
|
Group II
|
Group III
|
| Age (y) |
42 ± 12.4 |
50 ± 9.8 |
44 ± 11.9 |
| BMI (kg/m2) |
25.75 (24-27) |
26.8 (25-28) |
25 (23-29) |
BMI- body mass index.
Data expressed as mean ± standard deviation.
Hb levels did not differ statistically significantly between hypothyroid individuals, hypothyroid individuals with diabetes, and control subjects. There is a statistically significant (P < 0.001) difference in the levels of FBS, PPBS, HbA1c, fT3, fT4, and TSH between hypothyroid individuals, hypothyroid individuals with diabetes, and control participants (P < < 0.001) (Table 2).
Table 2.
Comparison of Hb, FBS, PPBS, and HbA1c between group I (hypothyroid individuals), group II (hypothyroid individuals with diabetes), and group III (control)
|
Variables
|
Group I
|
Group II
|
Group III
|
P
value
|
| Hb (g/dL) |
13 (12-14) |
13.05 (12-14) |
13 (12-14.025) |
0.924 |
| FBS (mg/dL) |
98 (94-104) |
134.5 (112-179) |
101 (96-106) |
< 0.001** |
| PPBS (mg/dL) |
117 (102-129) |
205.5 (163-244) |
117 (108-129) |
< 0.001** |
| HbA1c (%) |
5.6 (5.5-5.7) |
7.75 (7.1-9.3) |
5.2 (5-5.3) |
< 0.001** |
| fT3 (pg/mL) |
2.78 (2.0-3.1) |
2.85 (2.18-3.08) |
2.87 (2.55-3.25) |
0.049* |
| fT4 (ng/dL) |
1.09(0.91-1.24) |
1.09 (0.87-1.2) |
1.22 (1.1-1.3) |
< 0.001** |
| TSH (μIU/mL) |
11.13 (6.9-22.9) |
10.02 (7.7-12.16) |
2.15 (1.33-1.60) |
< 0.001** |
Hb, hemoglobin; FBS, fasting blood sugar; PPBS, postprandial blood sugar; HbA1c, glycated hemoglobin; fT3, free triiodothyronine; fT4, free thyroxine; TSH, thyroid stimulating hormone.
Data expressed as median with interquartile range. Comparison is done by Kruskal-Wallis test.
**P value highly significant; *P value significant.
In the hypothyroid group, there was a positive correlation between HbA1c and TSH with a P value of < 0.01 and a correlation coefficient of 0.281 (Table 3, Figure 1). The correlation between HbA1c and TSH in hypothyroid individuals with diabetes showed a positive association between the two indices and was statistically significant with a P value 0.02 (Table 3, Figure 2).
Table 3.
Correlation analysis of HbA1c with fT3, fT4, and TSH between group I (hypothyroid individuals), group II (hypothyroid individuals with diabetes), and group III (control)
|
Variable
|
Group I
|
Group II
|
Group III
|
|
r value
|
P
value
|
r value
|
P
value
|
r value
|
P
value
|
| fT3 |
-0.046 |
0.705 |
-0.220 |
0.068 |
-0.085 |
0.485 |
| fT4 |
-0.384 |
<0.001
**
|
-0.384 |
0.989 |
-0.026 |
0.834 |
| TSH |
0.281 |
<0.01
*
|
0.278 |
0.02
*
|
0.074 |
0.541 |
fT3, free triiodothyronine; fT4, free thyroxine; TSH, thyroid stimulating hormone.
Spearman correlation was done. The correlation coefficient expressed as R value.
**P value highly significant; *P value significant.
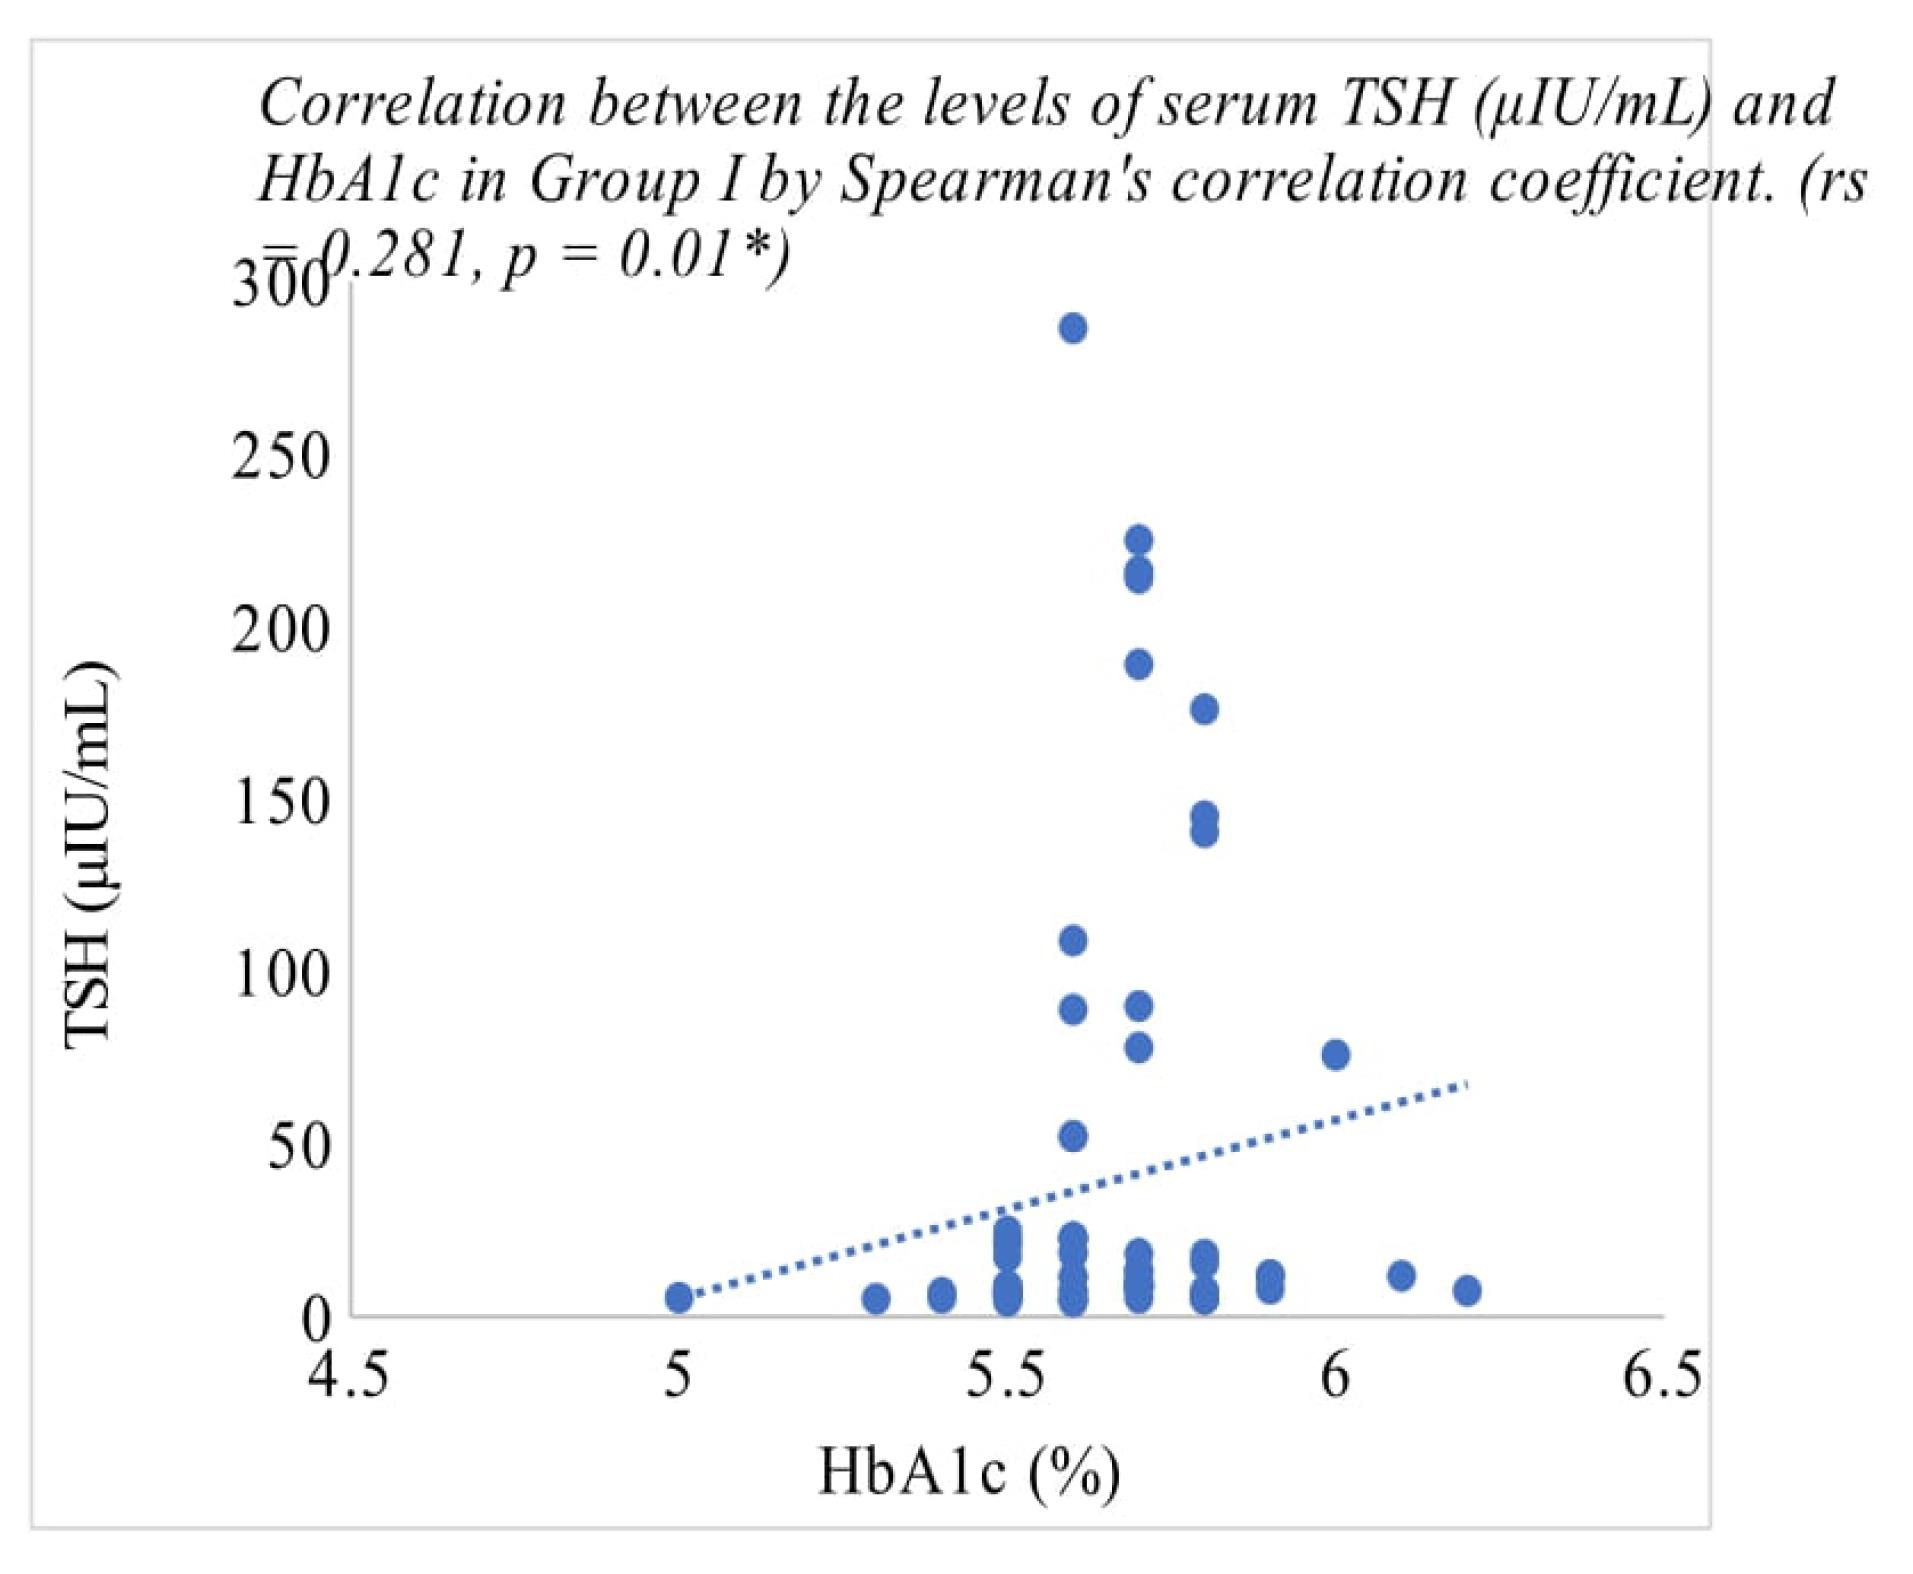
Figure 1.
Correlation analysis for HbA1c with TSH in Group I (hypothyroid)
.
Correlation analysis for HbA1c with TSH in Group I (hypothyroid)
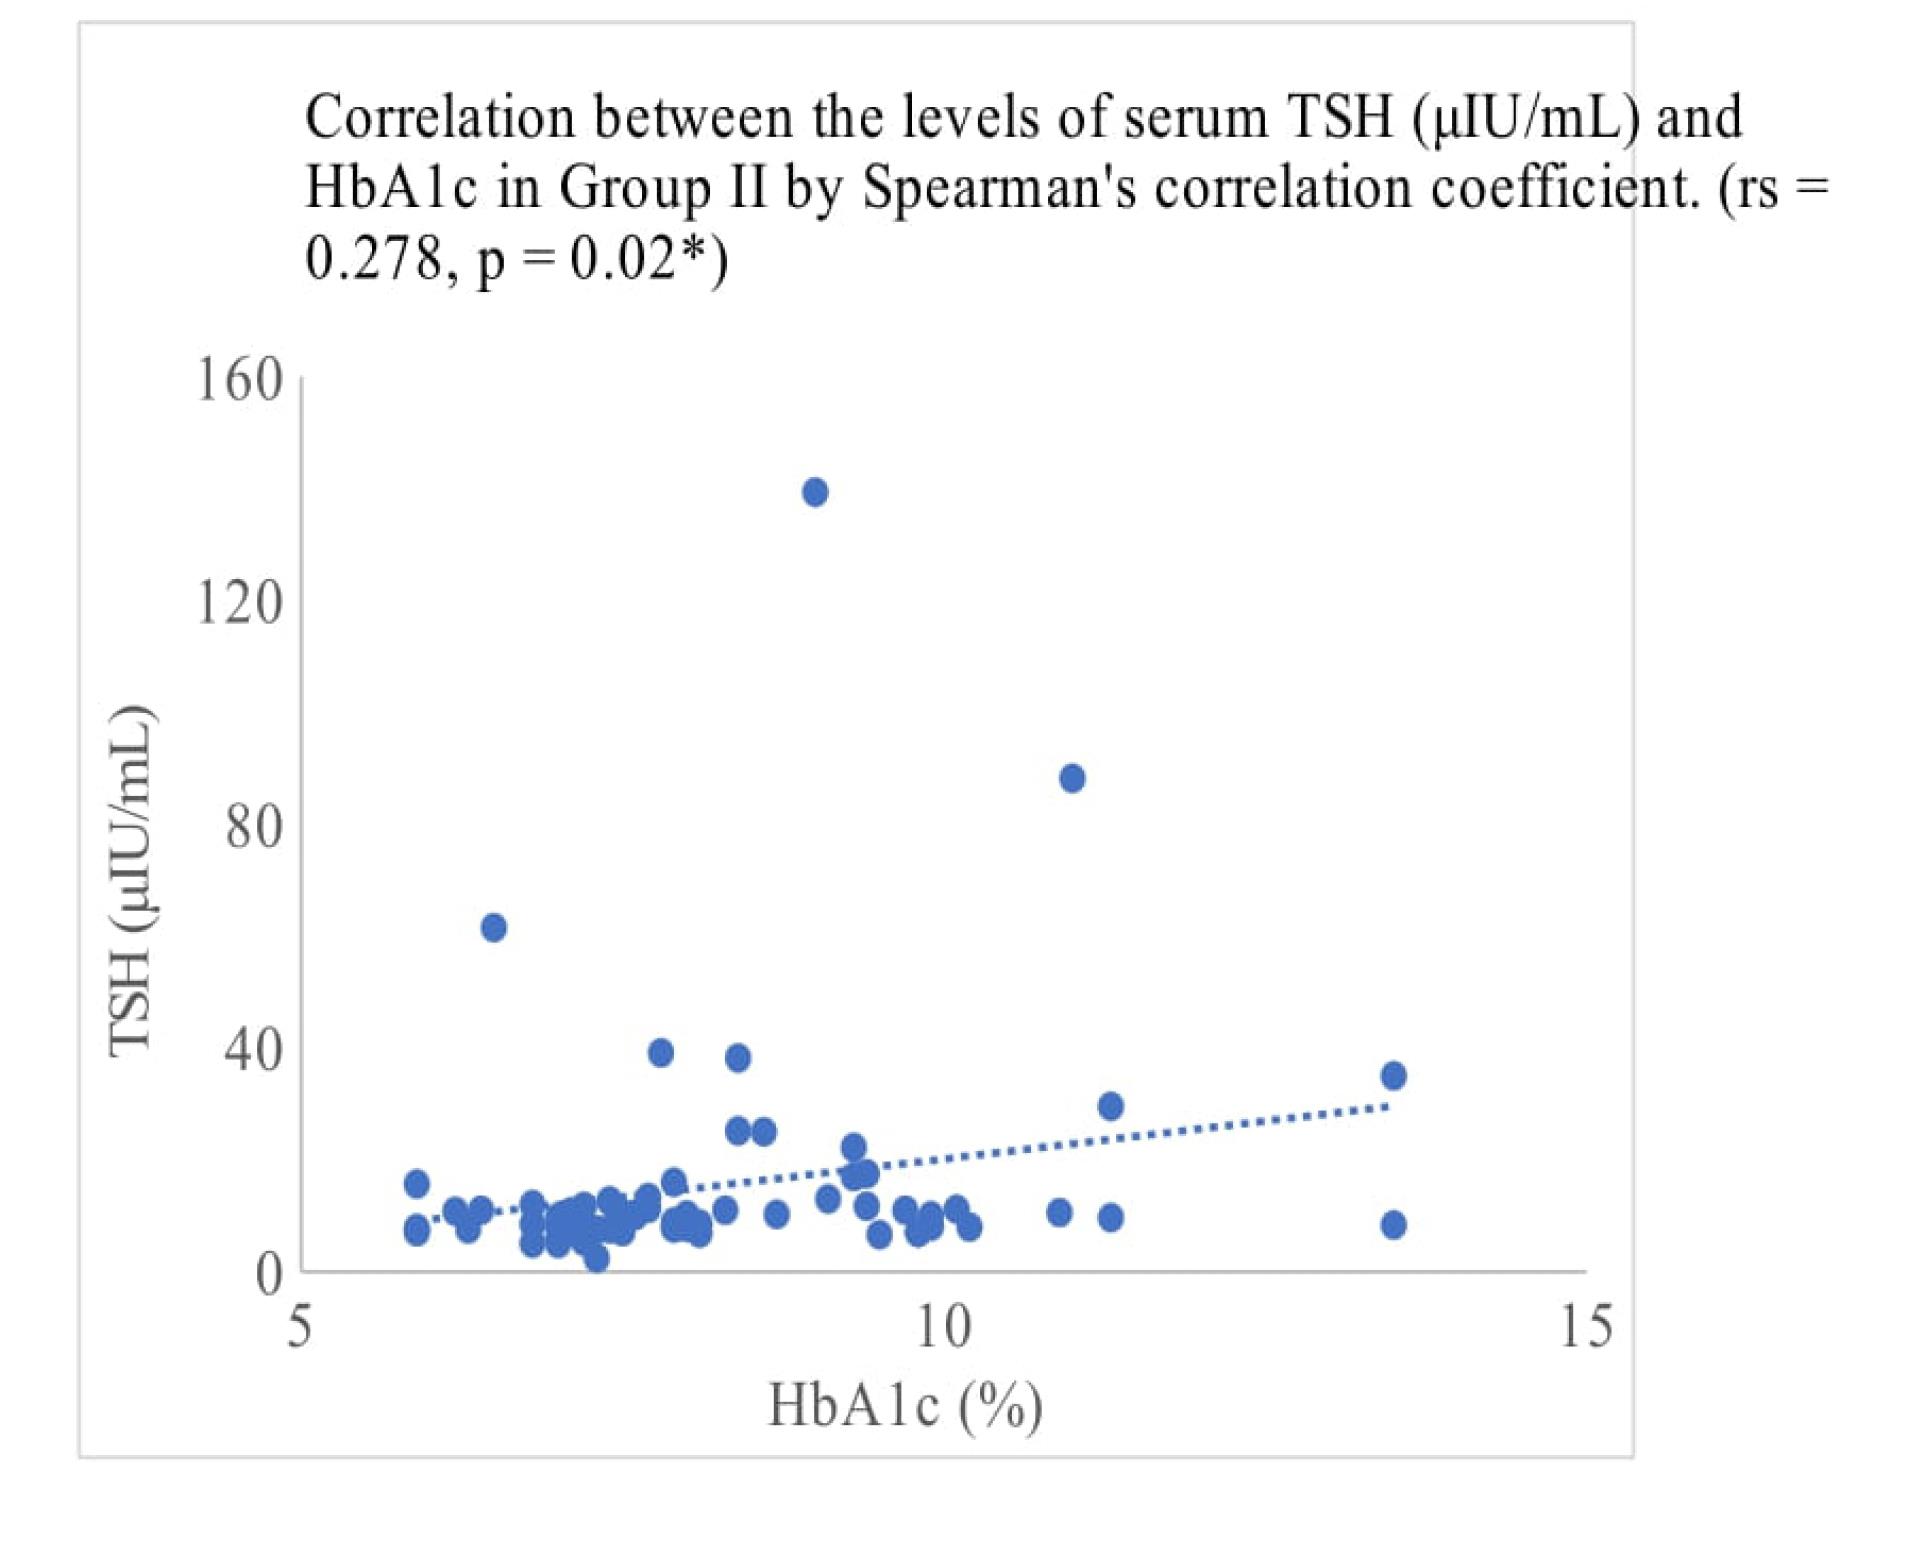
Figure 2.
Correlation analysis for HbA1c with TSH in Group II (diabetic with hypothyroid)
.
Correlation analysis for HbA1c with TSH in Group II (diabetic with hypothyroid)
Discussion
The American Diabetes Association recommended using HbA1c for diagnosing individuals with DM.2 However, in certain circumstances, the use of HbA1c may not accurately reflect the glycemic status. In conditions where the ratio of young to old RBCs in circulation is reversed and in circumstances where the life span of RBC increases or decreases, can impact HbA1c levels independent of glycemic state.3,4 Due to this connection, conditions like iron insufficiency, vitamin B12 deficiency, or renal failure which lead to a predominance of older RBCs in circulation, could falsely elevate HbA1c levels.5 Hypothyroidism is one such frequently observed condition, and thus, we set out to analyze it in this study.
When comparing hypothyroid individuals to normal individuals, the median HbA1c value in the hypothyroid individuals was statistically considerably higher (P< 0.001). Despite the fact that the median values of FBS and PBBS were normal, hypothyroid individuals’ baseline HbA1c levels were close to the prediabetic range.
This elevation of HbA1c levels was also established by Urrechaga et al6 in their study; They found that despite the lower levels of fasting blood glucose in the hypothyroid individual, HbA1c levels among hypothyroid individuals were considerably higher than those in control subjects.Hussain et al7 study results revealed that the HbA1c levels in the hypothyroid individuals were considerably higher than those in control individuals, supporting our study findings. They also showed that the levels of TSH were statistically significant in hypothyroid individuals than in the control participants. Also, Bhattacharjee et al8 study demonstrated that TSH and HbA1c levels in hypothyroid individuals were significantly higher than in control participants.
Low levels of fT3 were absorbed over the course of the study among hypothyroid individuals and hypothyroid individuals with diabetes. This low fT3 state may be a result of hyperglycemia, which decreases the peripheral conversion of T4 to T3 through a 5 monodeiodination process, thus increasing T4 levels while suppressing T3 levels.9,10
In this study, HbA1C levels in hypothyroid individuals were positively correlated with TSH levels (rs = 0.2811*, P < 0.01) and negatively correlated with FT4 levels (rs = -0.384**, P < 0.001). Similar results were evident in the research conducted by Samarjit et al,6 Hussain et al7 and Acharya et al11 which showed a strong positive association between TSH and HbA1c levels.Samarjit et al6 in their study also demonstrated a negative correlation between serum fT4 and HbA1c levels.
Thyroid hormones have a crucial function in the process of erythropoiesis. In hypothyroid individuals, both the erythroid cells’ proliferative activity and the overall number in the bone marrow are reduced. Furthermore, individuals with significant hypothyroidism showed a gelatinous alteration in the marrow ground substance, which is characterized by mucopolysaccharide build-up. Reduced RBC turnover is caused by repressed bone marrow as a result of decreased erythrocyte production caused by lower thyroid hormone synthesis levels. As a result of low RBC turnover, this could lead to falsely elevated HbA1c levels.12,13
Thyroid hormone replacement therapy is associated with reduced HbA1c levels, which is influenced by enhancing erythropoiesis rather than changes in glucose concentrations.12
In hypothyroid individuals with diabetes, the levels of TSH and HbA1c were positively correlated (r = 0.278, P < 0.020). These findings are consistent with previous research conducted by Vamshidhar and Rani, in his study; where he found a positive relationship between HbA1c and TSH.14 This may have been related to changes in the synthesis and release of thyrotropin-releasing hormone (TRH). In Type 2 diabetic individuals, hyperglycemia is known to have a deleterious impact on thyroid function which includes specifically blunting the pituitary TSH response to hypothalamic TRH stimulation. DM is characterized by insulin resistance, mitochondrial dysfunction, and an increase in oxidative stress which leads to an increase in the glycation of proteins. The glycated proteins’ tendency to accumulate in tissues also contributes to higher HbA1c levels.15,16
Limitations
This is a unicentric study, which is prospective in nature. This study did not include follow-up after starting thyroid hormone replacement therapy. Future research should include a larger cohort population with follow-up. In diabetic subjects with hypothyroidism, the actual glycemic status needs to be confirmed with other measures such as glycated albumin.
Study Highlights
What is current knowledge?
-
T HbA1c is a commonly used marker for screening and diagnosis of diabetes mellitus. However, it can be influenced by several factors including hemoglobin levels, red cell turnover, and non-glycemic factors such as thyroid disorders. Previous studies have shown that baseline HbA1c levels were found to be falsely elevated in hypothyroid individuals without any change in blood glucose levels.
What is new here?
-
This study was uniquely conducted in three groups: individuals with hypothyroid, hypothyroid individuals with diabetes, and euthyroid euglycemic controls. The results showed a significant positive correlation between TSH levels and HbA1c in both the hypothyroid group and hypothyroid-diabetes group. Additionally, the study also mentioned that diabetic individuals have a deleterious impact on thyroid function. These findings highlight the importance of accurately interpreting HbA1c values in individuals with thyroid dysfunction as they may result in misinterpretation of the glycemic status of the individuals.
Conclusion
According to the data gathered, the baseline HbA1c levels in hypothyroid individuals were significantly higher than in normal subjects. In hypothyroid individuals, HbA1c and TSH levels showed a weak positive correlation. As a result of the reduced erythropoiesis associated with hypothyroidism, HbA1c levels are elevated. Therefore, HbA1c levels should be interpreted with caution in individuals with thyroid dysfunction as they may lead to a misinterpretation of the glycemic status of the individuals. This can be considered by clinicians when treating diabetic hypothyroid individuals.
Acknowledgments
We would like to acknowledge everyone who supported us in preparing this article.
Competing Interests
The authors have no conflicts of interest to disclose.
Ethical Approval
The study was approved by the Institutional Ethics Committee of Sri Ramachandra Institute of Higher Education and Research (code number: CSP-MED/21/JUN/69/96, dated 24.6.2021)
References
- American Diabetes Association. Diagnosis and classification of diabetes mellitus. Diabetes Care 2010; 33(Suppl 1):S62-9. doi: 10.2337/dc10-S062 [Crossref] [ Google Scholar]
- World Health Organization. Use of Glycated Haemoglobin (HbA1c) in the Diagnosis of Diabetes Mellitus: Abbreviated Report of a WHO Consultation. Geneva: WHO; 2011.
- Bunn HF, Haney DN, Kamin S, Gabbay KH, Gallop PM. The biosynthesis of human hemoglobin A1c Slow glycosylation of hemoglobin in vivo. J Clin Invest 1976; 57(6):1652-9. doi: 10.1172/jci108436 [Crossref] [ Google Scholar]
- Coban E, Ozdogan M, Timuragaoglu A. Effect of iron deficiency anemia on the levels of hemoglobin A1c in nondiabetic patients. Acta Haematol 2004; 112(3):126-8. doi: 10.1159/000079722 [Crossref] [ Google Scholar]
- Rezaei M, Rabizadeh S, Mirahmad M, Hajmiri MS, Nakhjavani M, Hemmatabadi M. The association between advanced glycation end products (AGEs) and ABC (hemoglobin A1C, blood pressure, and low-density lipoprotein cholesterol) control parameters among patients with type 2 diabetes mellitus. Diabetol Metab Syndr 2022; 14(1):122. doi: 10.1186/s13098-022-00895-w [Crossref] [ Google Scholar]
- Urrechaga E, Valladares C, Martinez A, Merino M, Muguerza G. The effect of thyroid status on HbA1c. Clin Chim Acta 2022; 530:S123-4. [ Google Scholar]
- Hussain K, Dev C, Rajput MZ, Memon WR, Hussain MT, Abro MA. Correlation between sub-clinical hypothyroidism and hemoglobin A1c in non-diabetic patients; a case control study. Ann Rom Soc Cell Biol 2020; 24(2):1692-6. [ Google Scholar]
- Bhattacharjee R, Thukral A, Chakraborty PP, Roy A, Goswami S, Ghosh S. Effects of thyroid status on glycated hemoglobin. Indian J Endocrinol Metab 2017; 21(1):26-30. doi: 10.4103/2230-8210.196017 [Crossref] [ Google Scholar]
- Pushparaj T. Correlation of thyroid stimulating hormone levels and hematological parameters among euthyroids, hypothyroids and hyperthyroids. Univ J Pre Paraclin Sci 2021; 7(1):197-280. [ Google Scholar]
- Lourbopoulos AI, Mourouzis IS, Trikas AG, Tseti IK, Pantos CI. Effects of thyroid hormone on tissue hypoxia: relevance to sepsis therapy. J Clin Med 2021; 10(24):5855. doi: 10.3390/jcm10245855 [Crossref] [ Google Scholar]
- Dorgalaleh A, Mahmoodi M, Varmaghani B, Kiani Node F, Saeeidi Kia O, Alizadeh S. Effect of thyroid dysfunctions on blood cell count and red blood cell indice. Iran J Ped Hematol Oncol 2013; 3(2):73-7. [ Google Scholar]
- Anantarapu S, Vaikkakara S, Sachan A, Phaneendra BV, Suchitra MM, Reddy AP. Effects of thyroid hormone replacement on glycated hemoglobin levels in non diabetic subjects with overt hypothyroidism. Arch Endocrinol Metab 2015; 59(6):495-500. doi: 10.1590/2359-3997000000065 [Crossref] [ Google Scholar]
- Bunn HF, Haney DN, Kamin S, Gabbay KH, Gallop PM. The biosynthesis of human hemoglobin A1c Slow glycosylation of hemoglobin in vivo. J Clin Invest 1976; 57(6):1652-9. doi: 10.1172/jci108436 [Crossref] [ Google Scholar]
- Vamshidhar IS, Rani SSS. A study of association of thyroid dysfunctions in patients with type 2 diabetes mellitus. Maedica (Bucur) 2020; 15(2):169-73. doi: 10.26574/maedica.2020.15.2.169 [Crossref] [ Google Scholar]
- Koner S, Chaudhuri A. Assessment of glycosylated hemoglobin (HbA1c) level in age and blood glucose matched nondiabetic hypothyroid and euthyroid females in an urban population of eastern India-an observational cross-sectional study. Int J Res Rev 2019; 6(5):10-7. [ Google Scholar]
- Gurunath S, Arun K, Krishna AV, Kavya L, Sridhar B. Clinical evidence of association between type-2 diabetes mellitus and hypothyroidism with therapeutic relevance—an observational study. Journal of Exploratory Research in Pharmacology 2019; 4(3):21-30. doi: 10.14218/jerp.2019.00001 [Crossref] [ Google Scholar]